Overview
This page is created to investigate Aurora serverless performance by comparing DB xlarge, 8xlarge and Aurora serverless instance types under load running Data Import (DI) with Check-in Check-out (CICO) running as background.
Summary
- The environment can handle the load with all compared DB instance types.
- No significant changes were observed comparing response times for CICO between two instance types db.r6g.xlarge and serverless.
- In Aurora serverless DI duration better for larger DI files.
- Serverless v2 (32 - 128 ACUs) DB instance type configuration performs better from the start than (0.5 - 128 ACUs) due to increased capacity and its performance closer to 8xlarge. But to cut costs it's better to use (0.5 - 128 ACUs) for DB reader instance role.
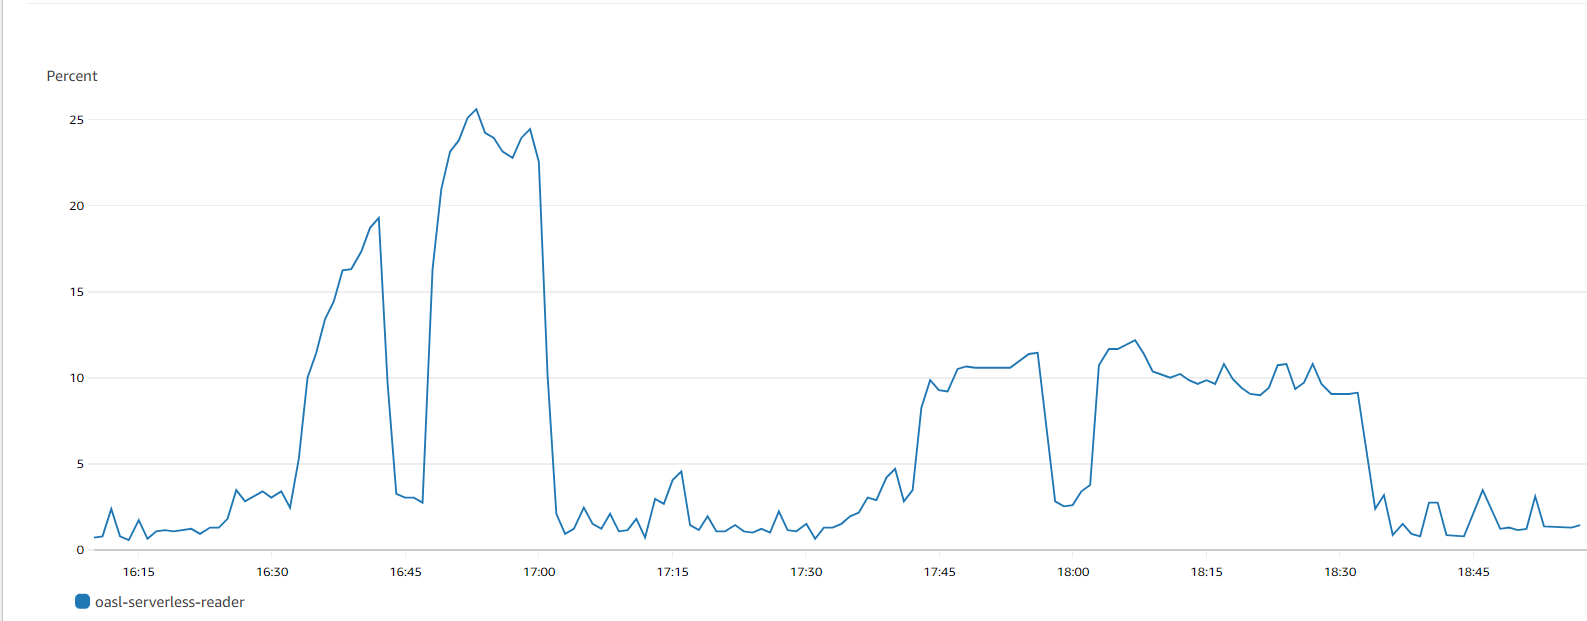
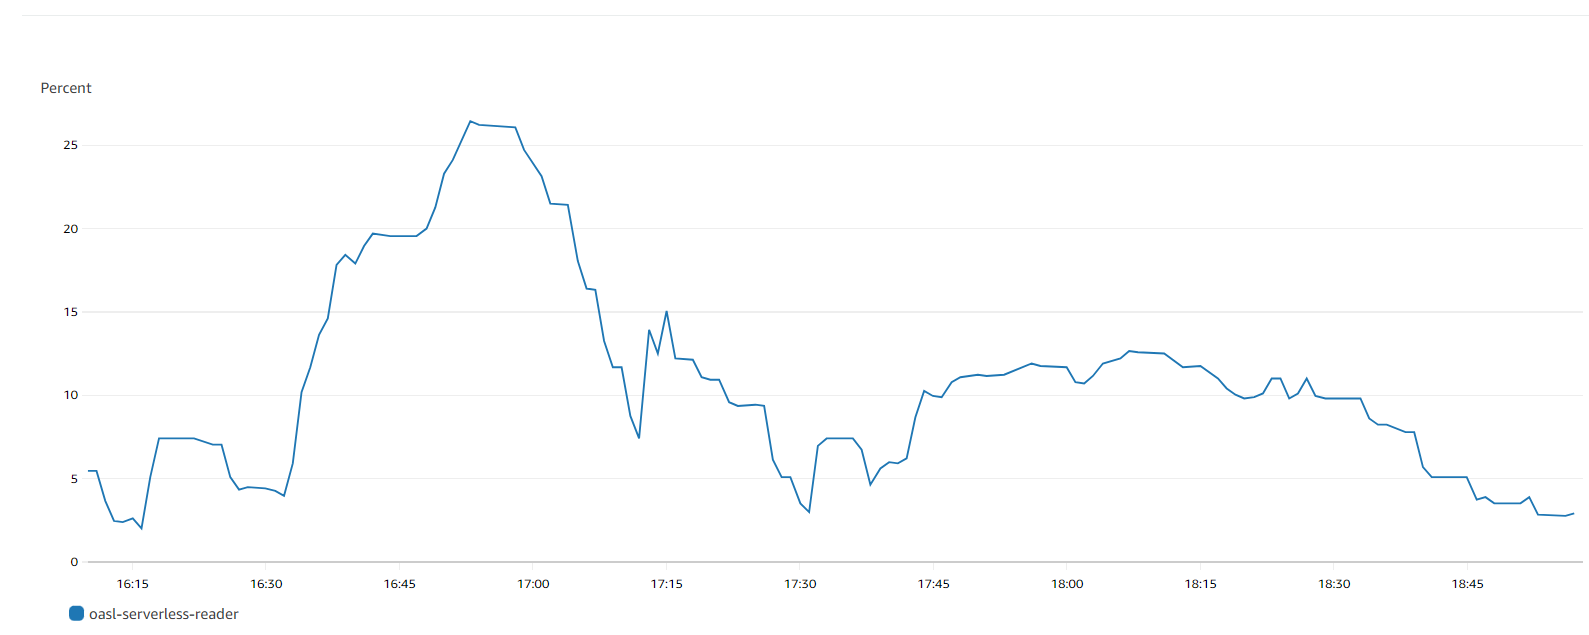
- Aurora serverless RDS CPU didn't exceed 25% for any file size. Execution time or test duration has tendency to decreasing for bigger file size because of bigger ACUs.
- Time duration of DI without CICO didn't change after task count: mod-inventory, mod-inventory-storage, mod-circulation, mod-circulation-storage x 4.
Results
The table includes test results from running on different database instance types Here we observe that RDS CPU utilization for db.r6g.xlarge has maximum values and test duration grows proportional to file size.
But after database was switched to Aurora serverless RDS CPU didn't exceed 25% for any file size. Execution time or test duration has tendency to decreasing for bigger file size because of bigger ACUs.
DI CICO Total resultsCreate | RDS db.r6g.8xlarge | RDS db.r6g.xlarge | Serverless Serverless v2 (0.5 - 128 ACUs) | Serverless Serverless v2 (32 - 128 ACUs) | |||||||||
| Users | File - Records | Duration (CICO) | Max CPU utilization | Duration | Max CPU utilization | Duration | Max CPU utilization | Duration | ACUs | Max CPU utilization | Duration | ||
| 1 | DI Create | 10k | 37 27 | 00:05:15 00:03:21 | 96 | 00:09:59 | 17 | 00:10:07 | 16 | 00:07:17 ↓ 28% | |||
| 25k | 45 30 | 00:10:04 00:08:08 | 96 | 00:18:19 | 24 | 00:13:43 | 22 | 00:11:44 ↓ 15% | |||||
| 50k | 30 | 00:15:54 | 93 | 00:37:05 | 25 | 00:22:57 | 24 | 00:20:01 ↓ 11% | |||||
| 2 | CICO + DI Create | 20 | 10k | 90 min | 39 | 00:04:32 | 94 | 00:08:08 | 19 | 00:09:12 | |||
| 25k | 47 | 00:09:01 | 96 | 00:19:21 | 26 | 00:14:30 | |||||||
| 3 | CICO DI Create JP: PTF - Create 2 | 20 | 10k | 90 min | 94 | 00:09:56 | 14 | 00:13:22 | 19 | ||||
| 25k | 94 | 00:21:06 | 24 | 00:23:49 | 25 | ||||||||
CICO DI Update JP: PTF - Updates Success - 1 | 20 | 10k | 90 min | 70 | 00:12:31 | 12 | 00:17:44 | 12 | |||||
| 25k | 70 | 00:29:12 | 12 | 00:31:35 | 13 | ||||||||
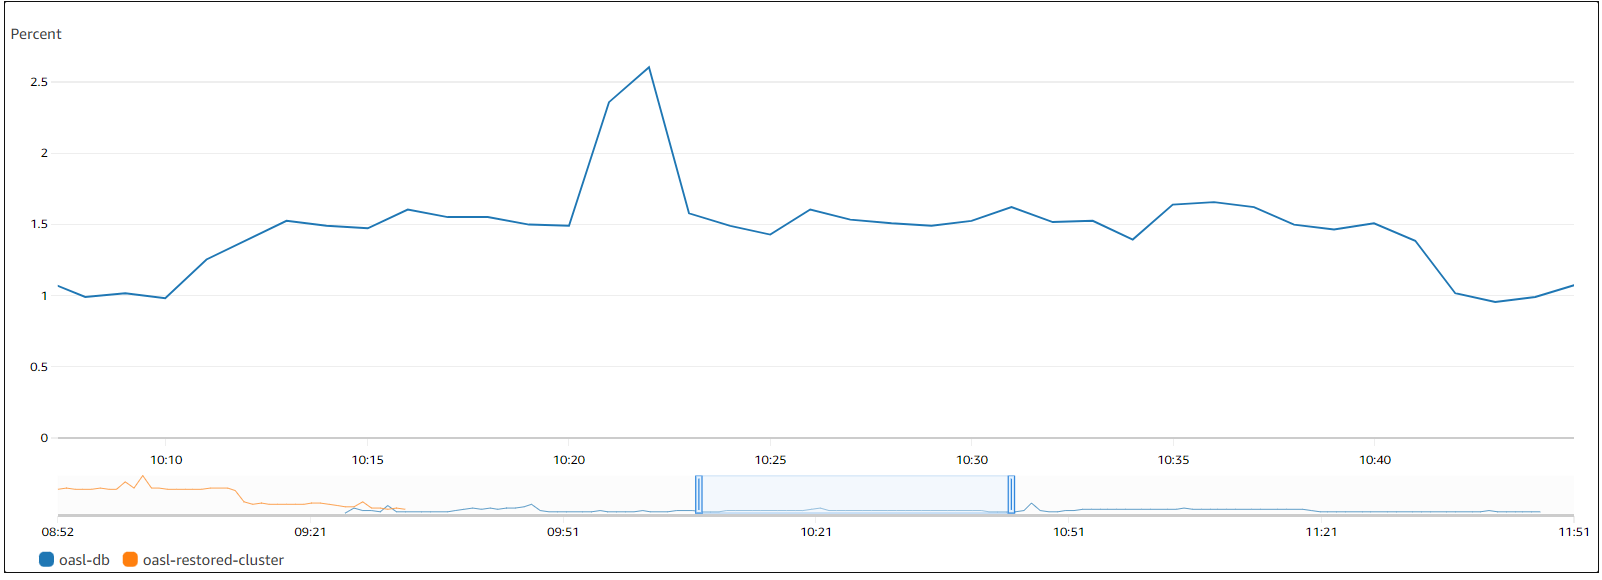
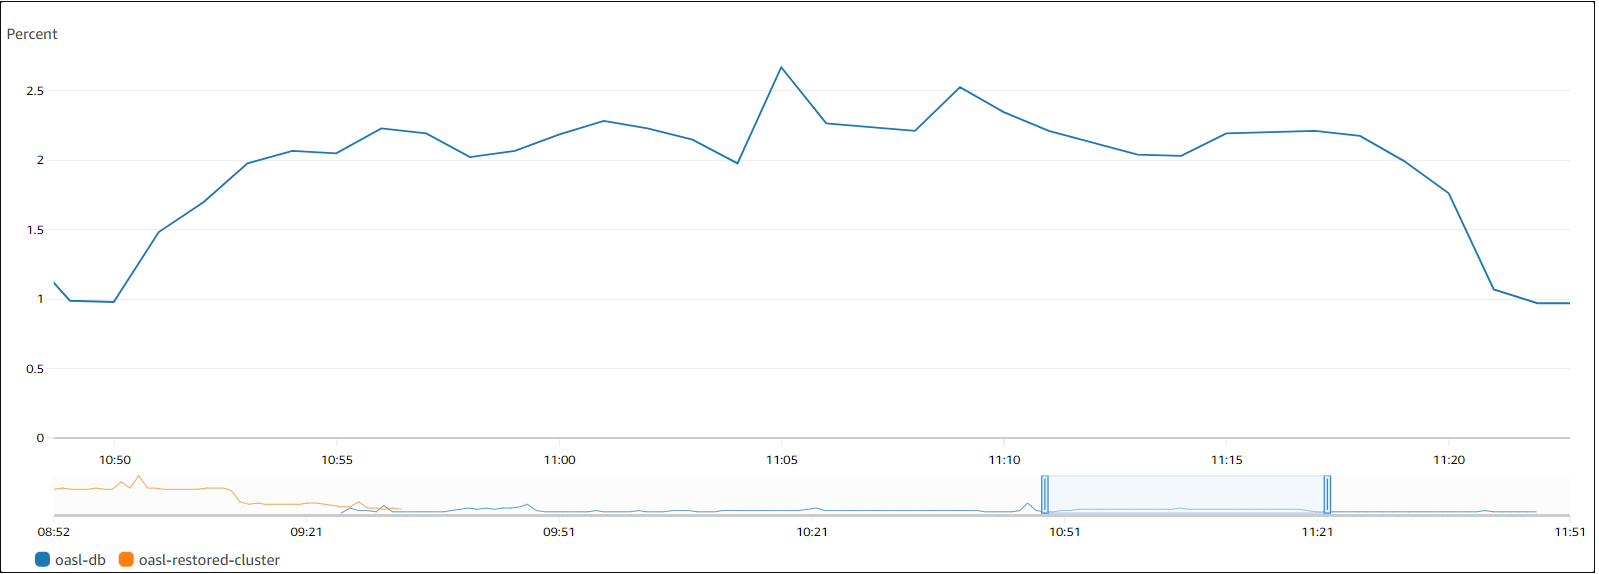
RDS CPU Utilization | |||
|---|---|---|---|
| 8xlarge | xlarge | serverless | |
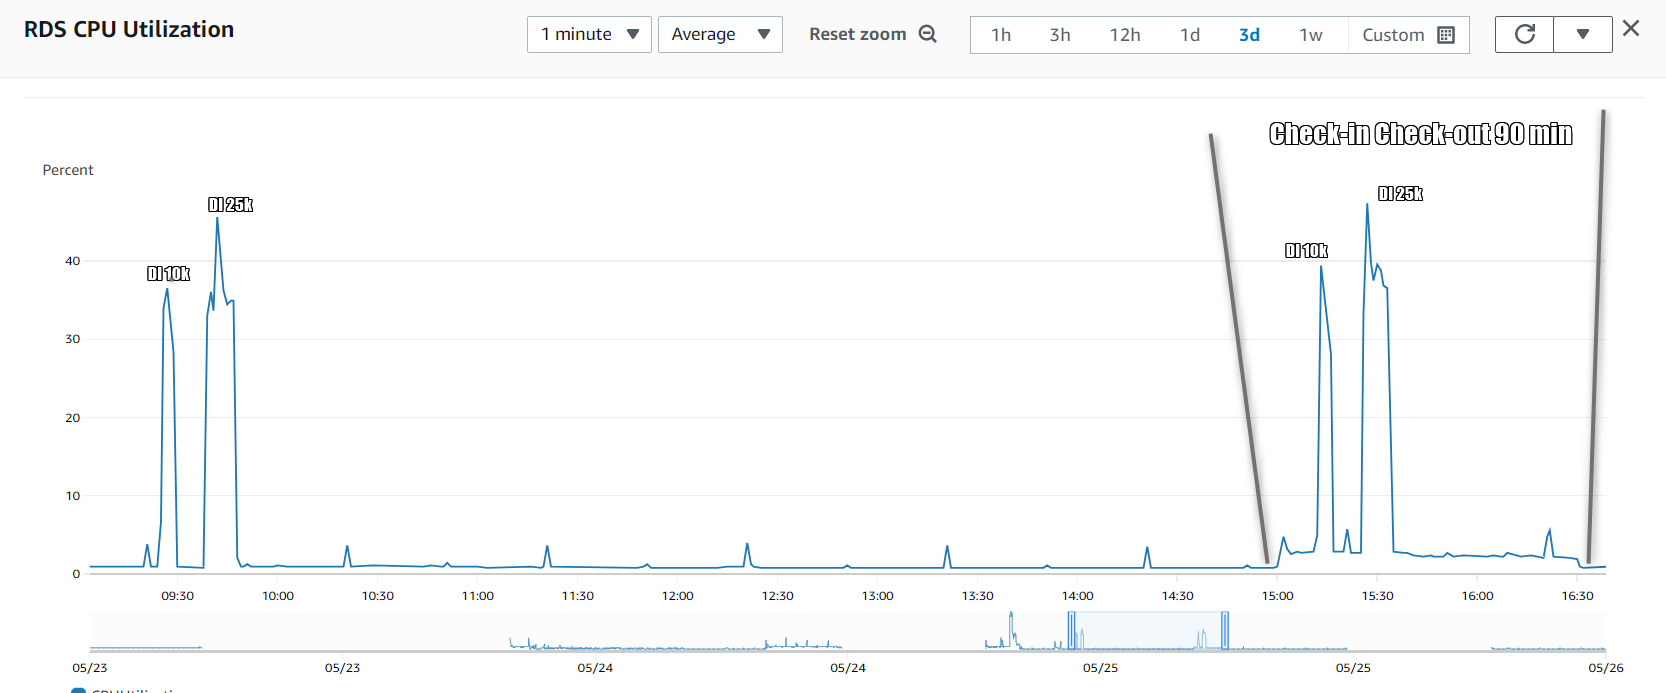
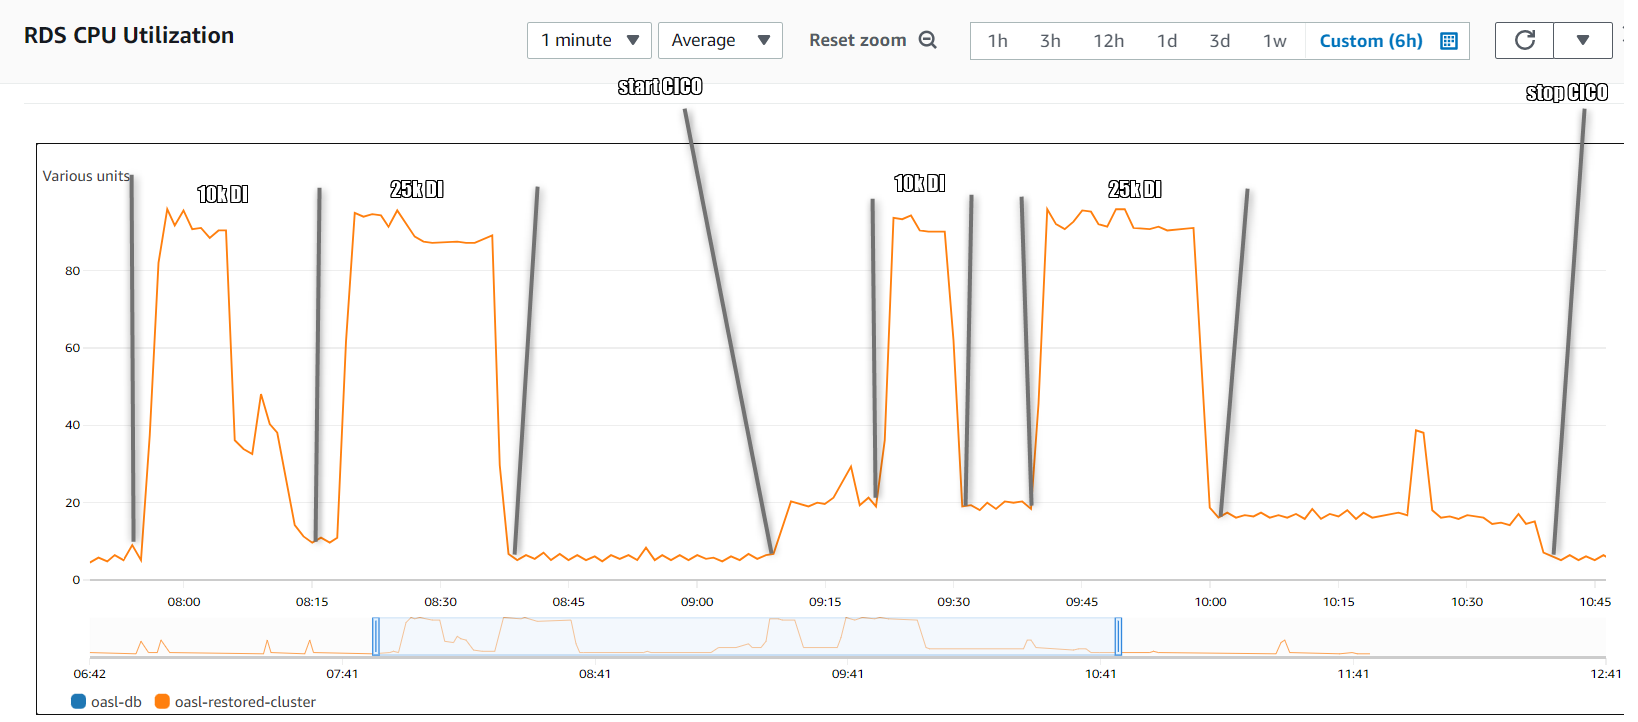
| RDS | CPU starts with spikes at the beginning of the tests and comes to normal after finish. Test date: 2023-05-25
| For xlarge database instance type CPU was maximum but it didn't affect DI any way. So it ran successfully Test date: 2023-05-29
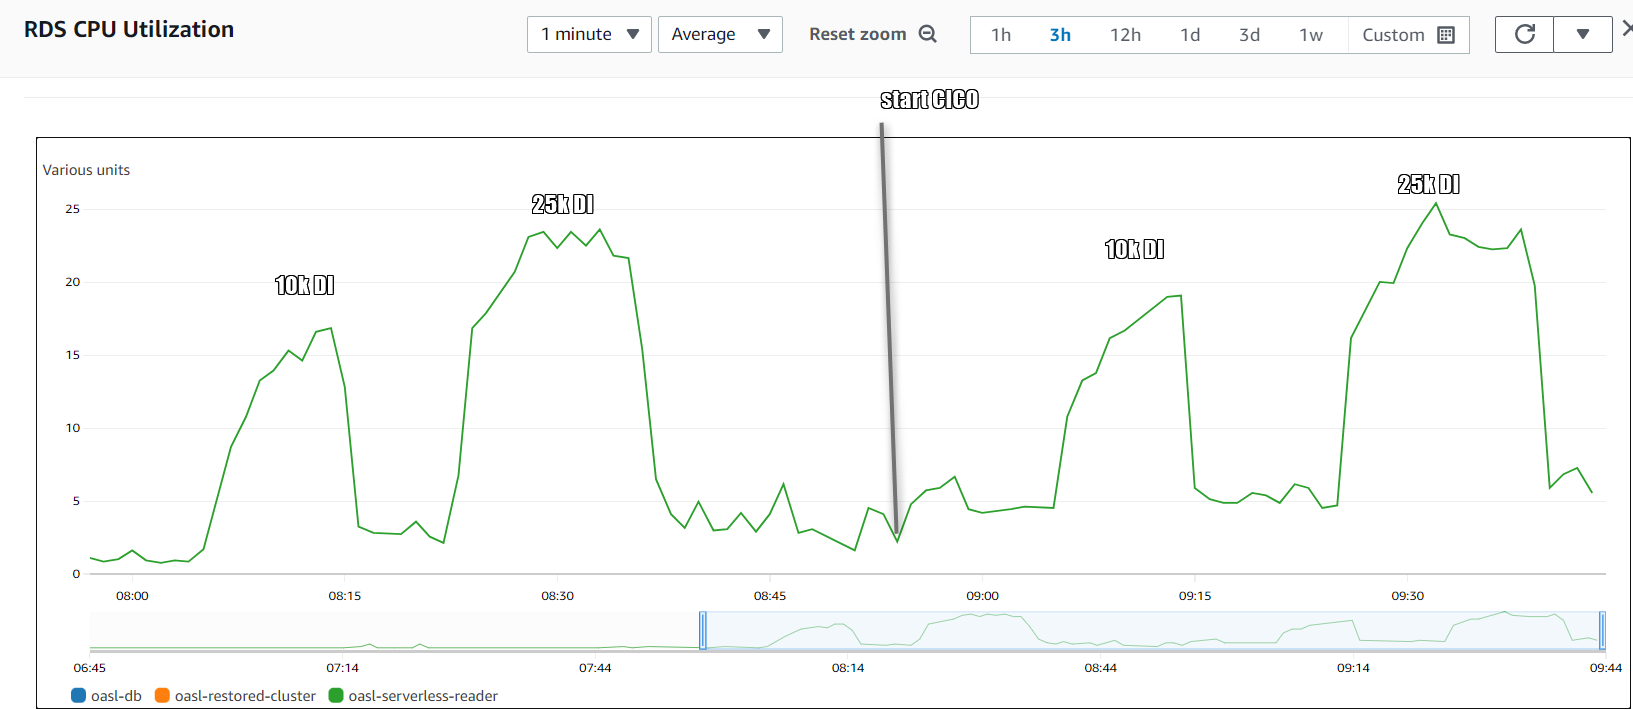
| For serverless CPU was stable and was not higher than 25% Test date: 2023-05-30
|
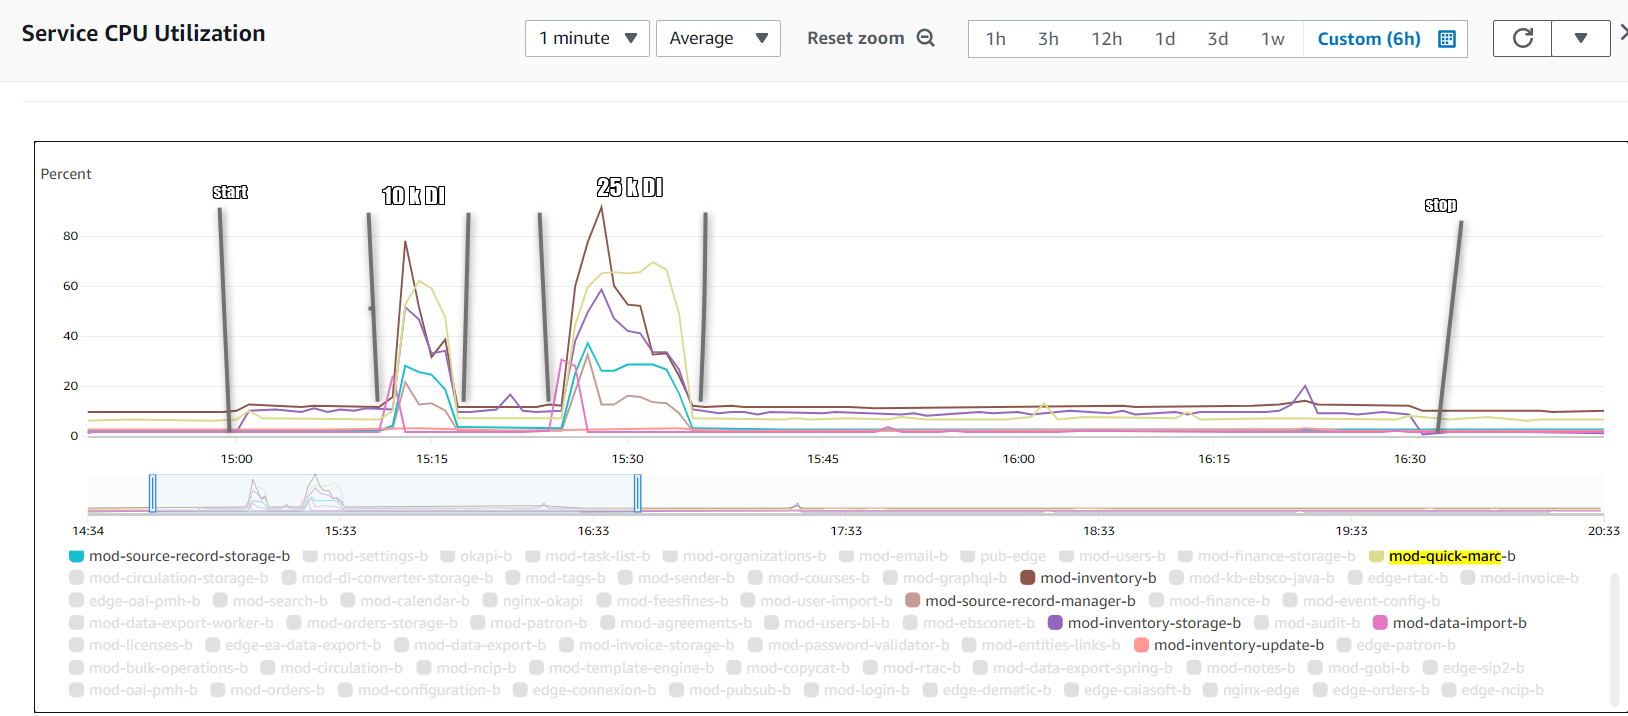
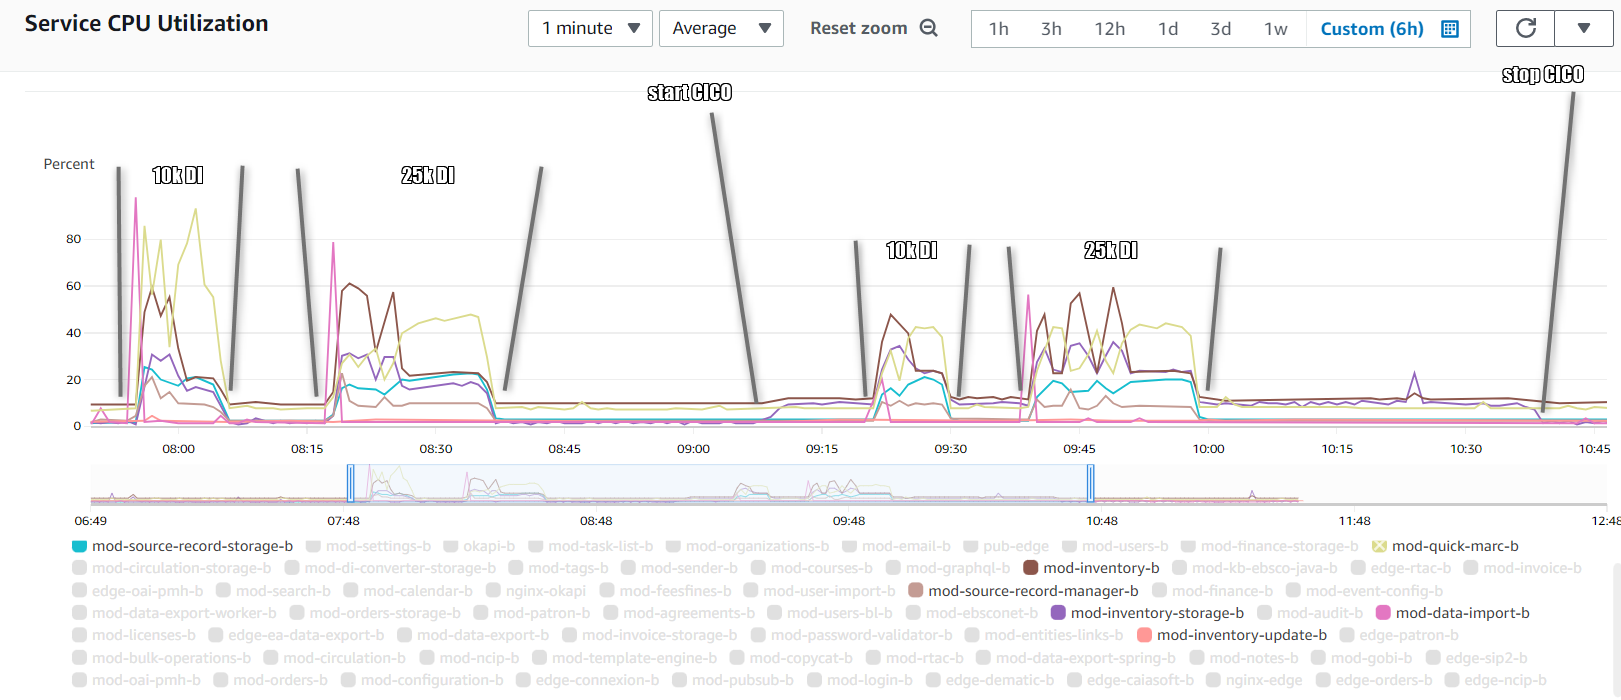
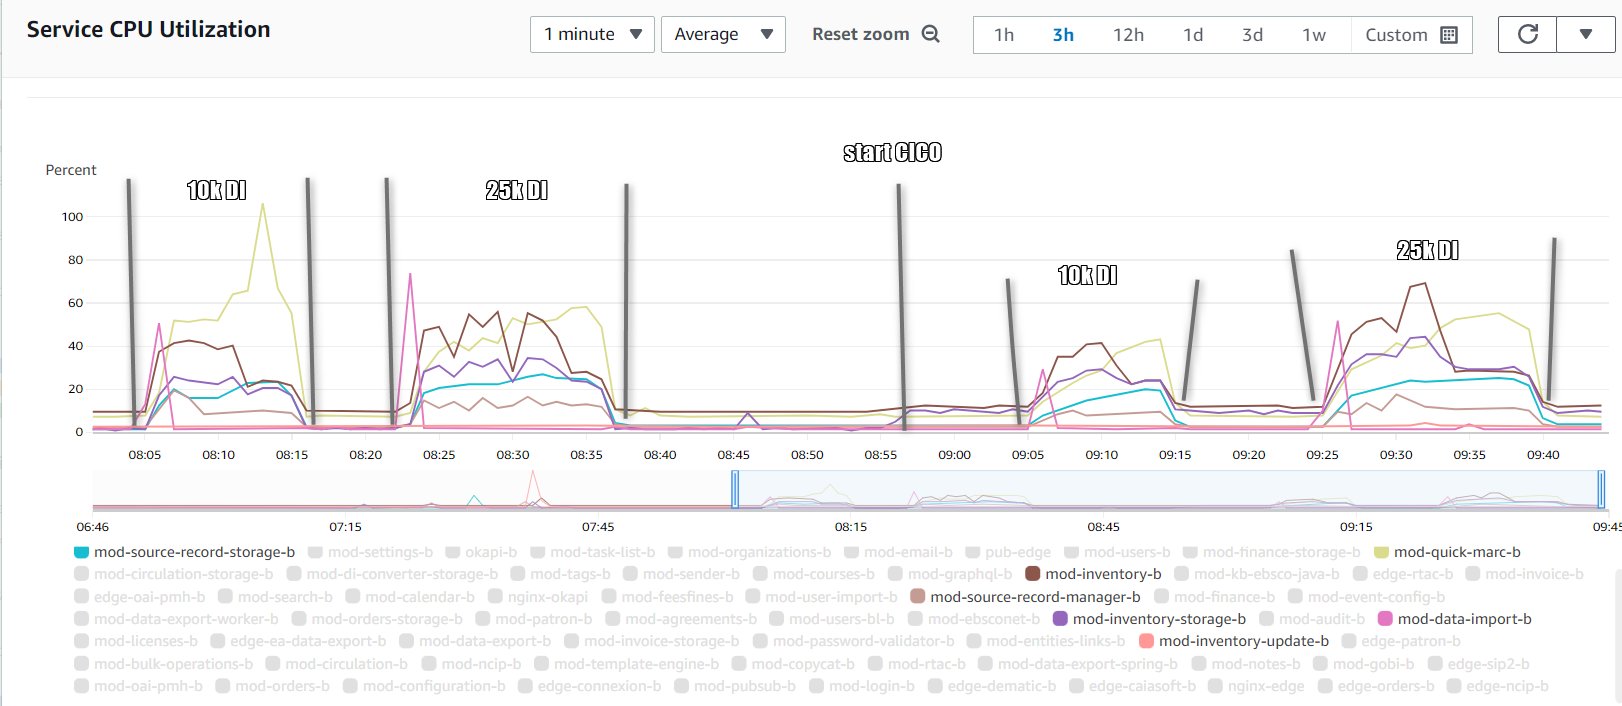
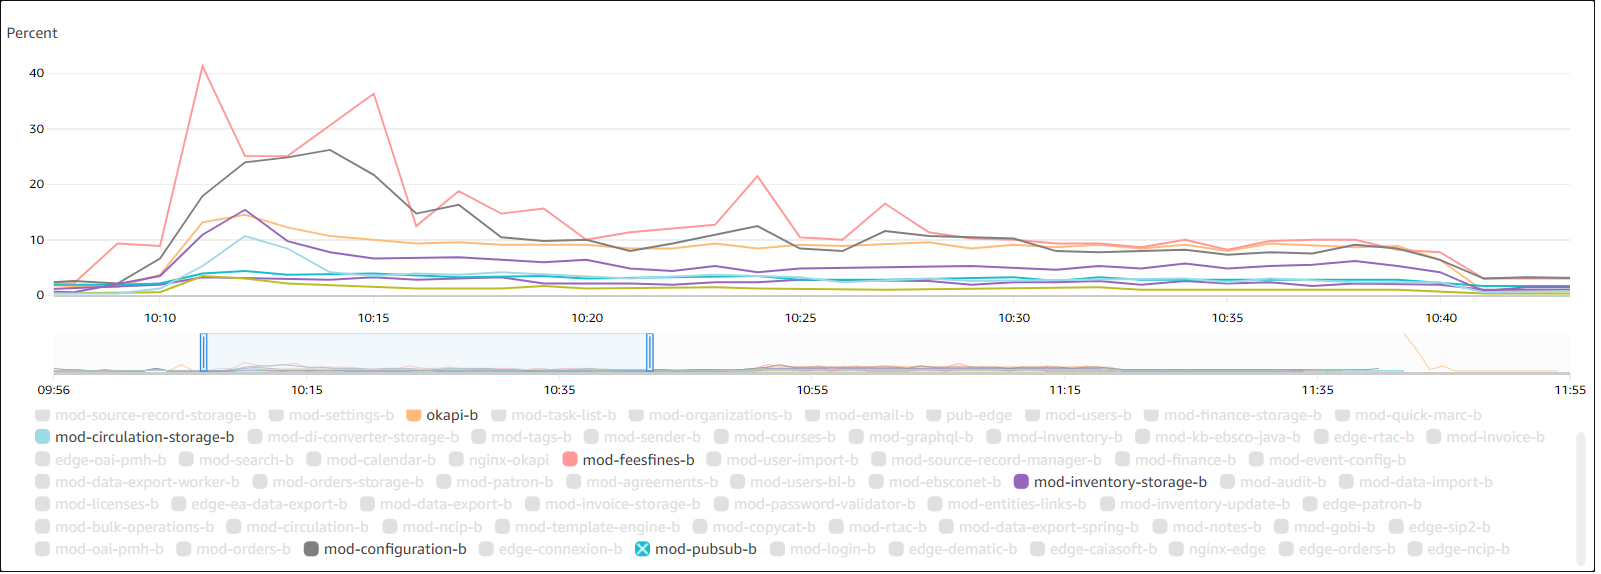
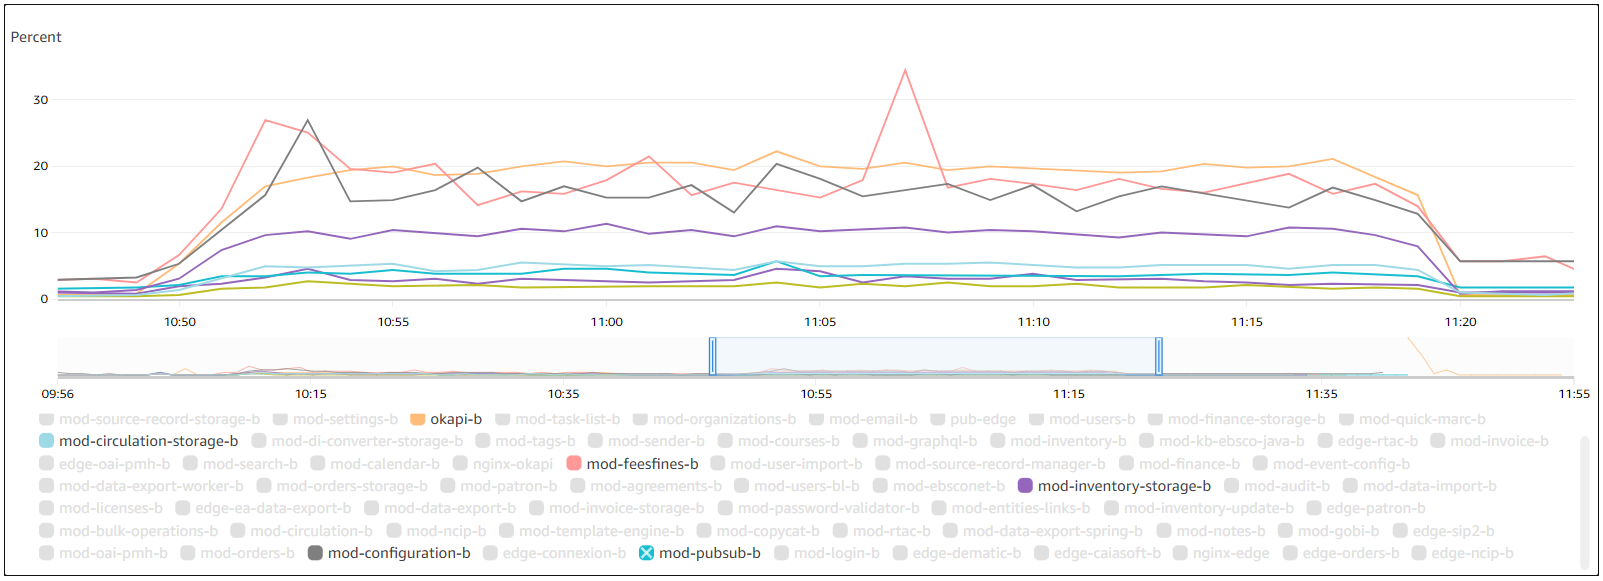
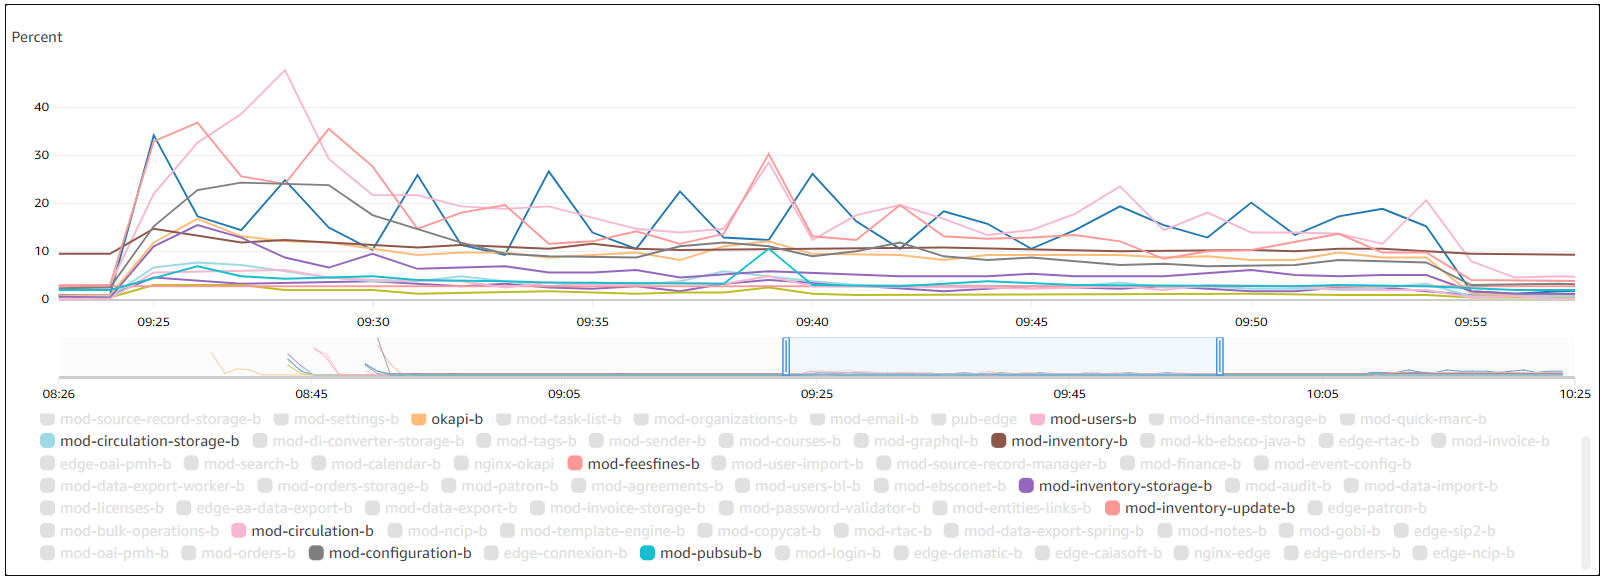
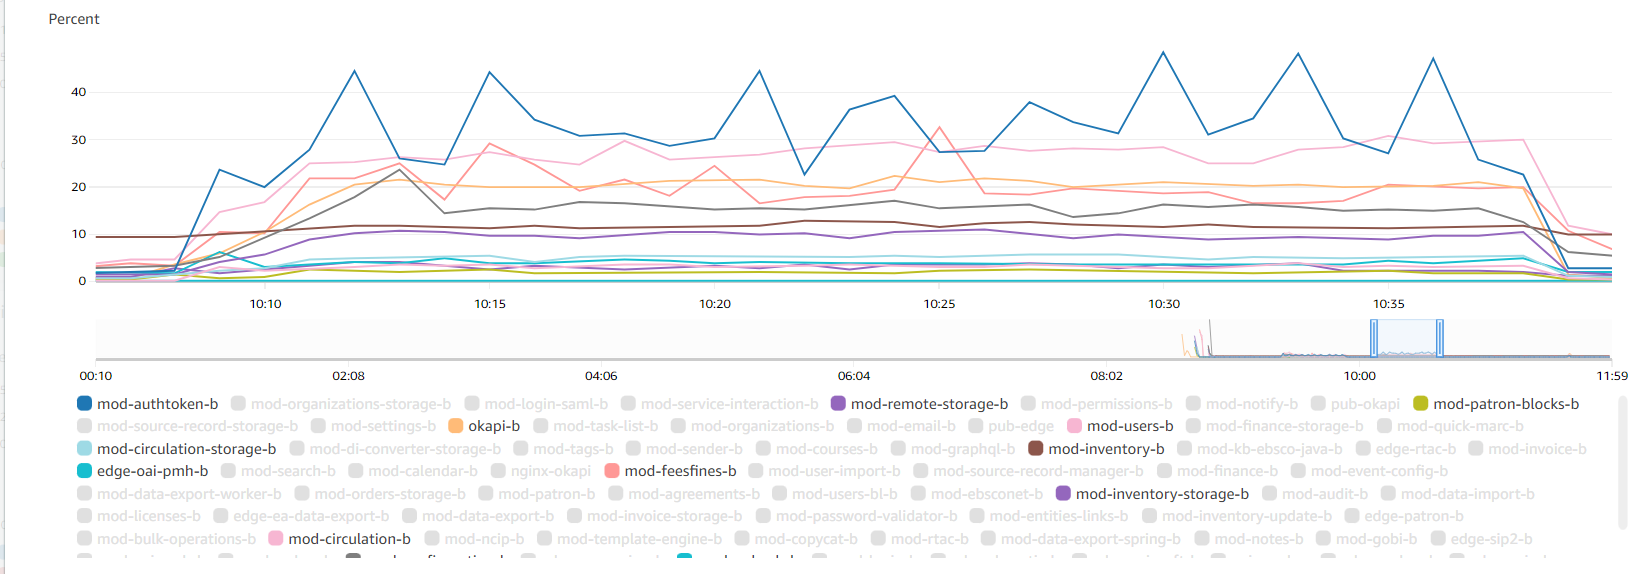
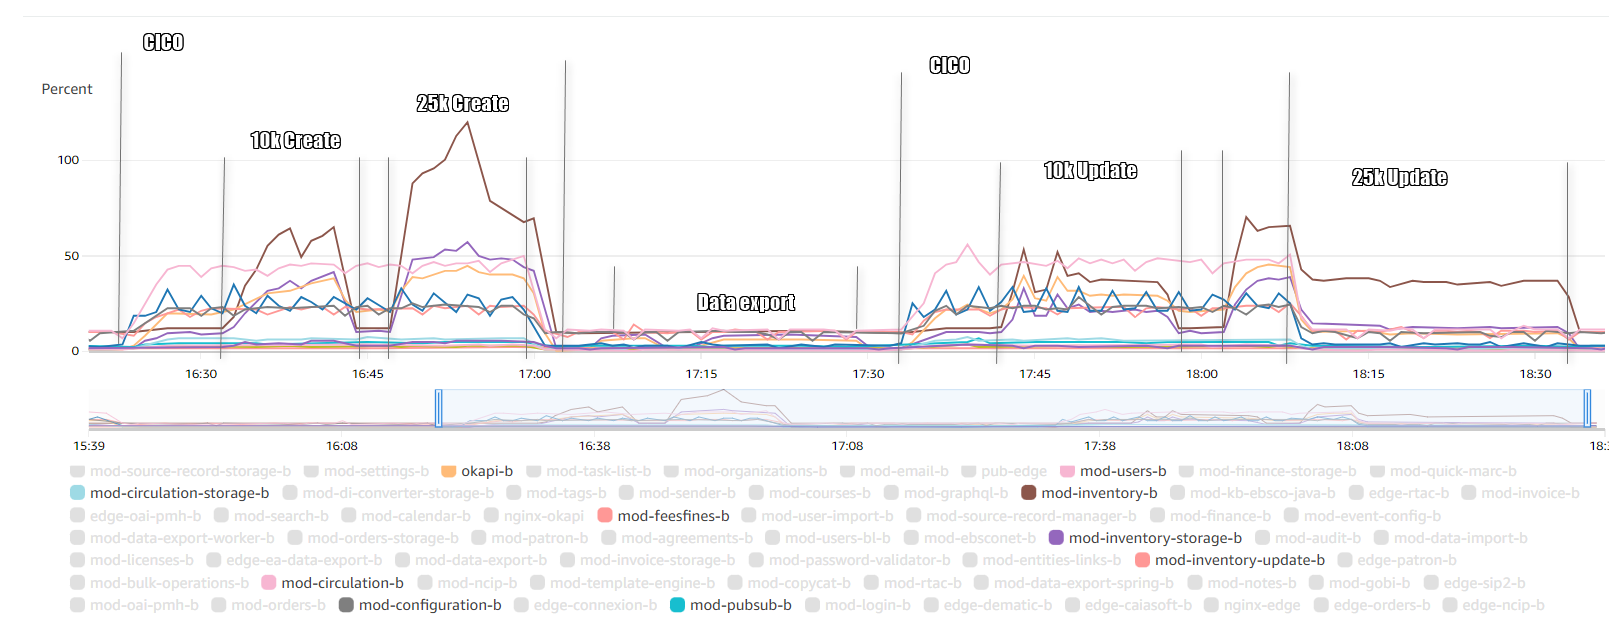
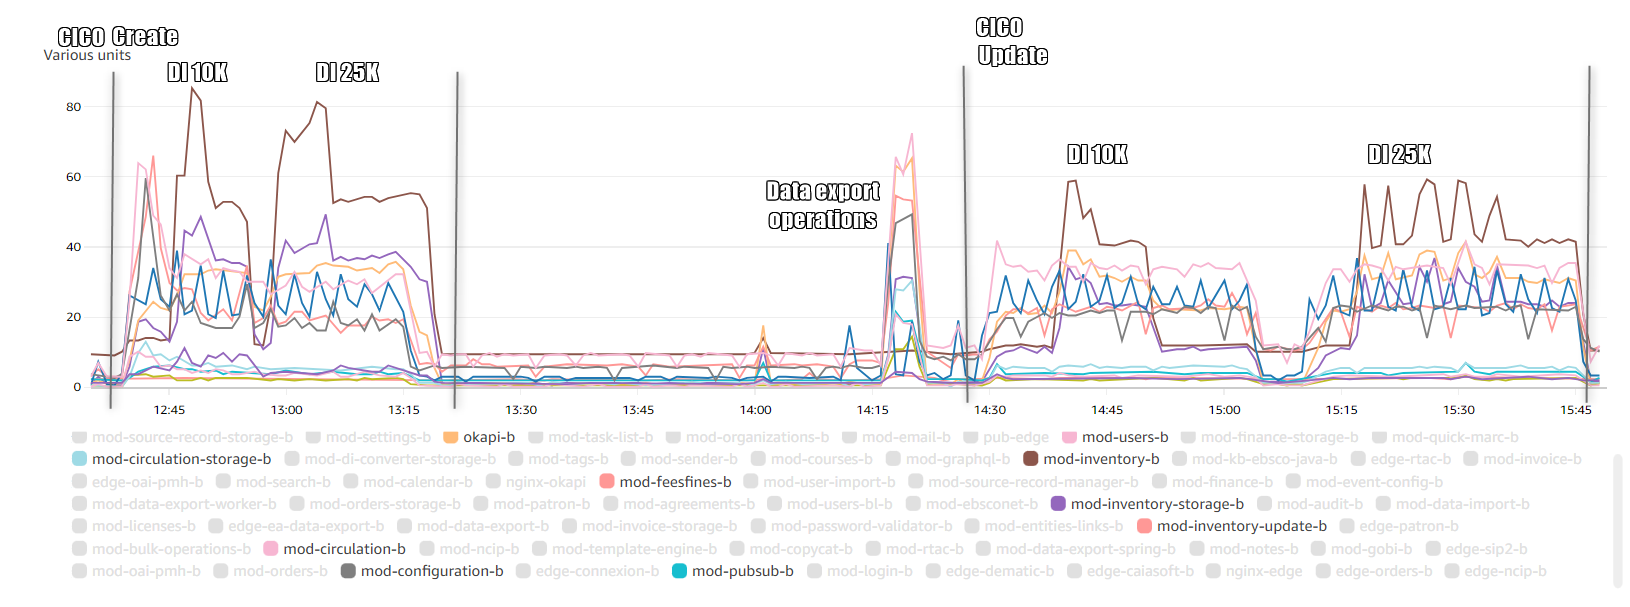
| Service | Data imports during CICO. The services worked stable and returned to there normal state after tests
| CICO background process didn't affect DI and it worked as expected
| Stable work of services
|
CICO resource consumption
Running tests for CICO PERF-593 - Getting issue details... STATUS I could observe that xlarge used more DB connections than any of DB instance types. The results mentioned in summary table show better response times over time for runs with 20 users. And no significant changes between different DB instance types. High latency was observed for all tests.
Testing results for CICOTest date: 2023-06-02 LG: us-west-2a | RDS (db.r6g.xlarge) | RDS (db.r6g.8xlarge) | Serverless v2 (0.5 - 128 ACUs) | Serverless v2 (32 - 128 ACUs) | |||||||||
| Users | Duration (CICO) | RDS max CPU utilization | DB connections | RDS max CPU utilization | DB connections | RDS max CPU utilization | ACUs | DB connections | RDS max CPU utilization | ACUs | DB connections | ||
| 1 | CICO | 8 | 30 min | 16 | 460 | 2 | 364 | 2.5 | 7.5 | 380 | 1.5 | 32 | 380 |
| 20 | 30 min | 21 | 430 | 2.5 | 378 | 4.7 | 6.2 | 396 | 2 | 32 | 380 | ||
CICO Graphs
db.r6g.xlarge | db.r6g.8xlarge | Serverless v2 (0.5 - 128 ACUs) | Serverless v2 (32 - 128 ACUs) | |
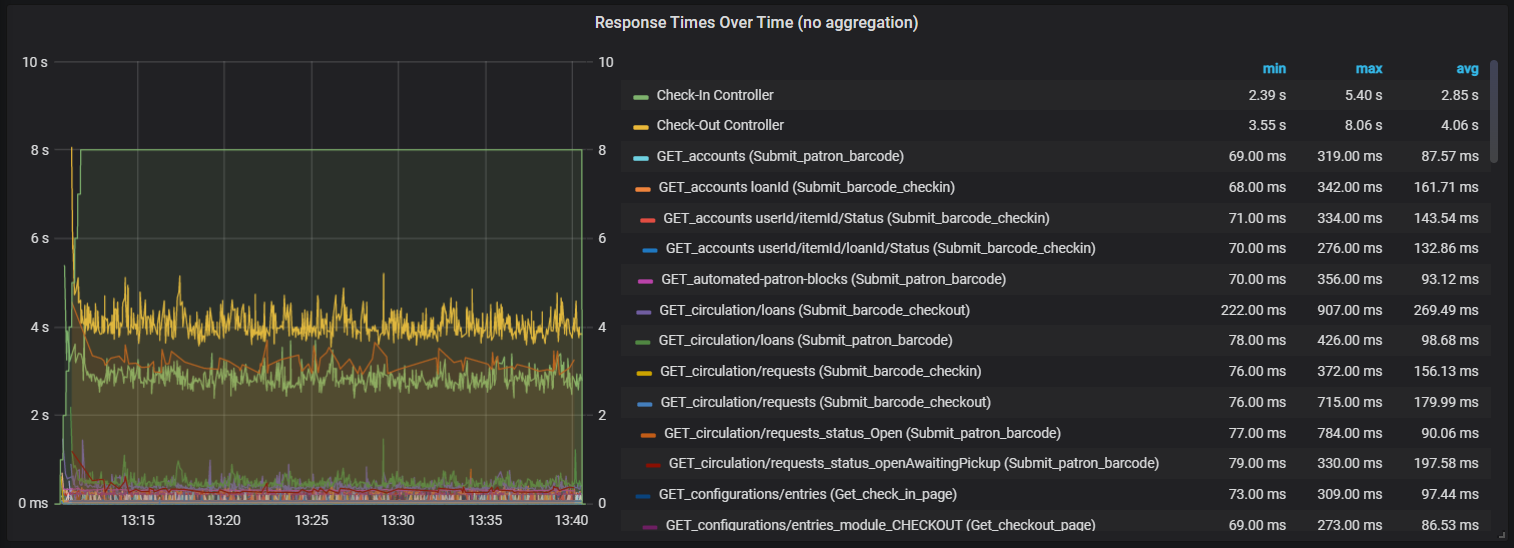
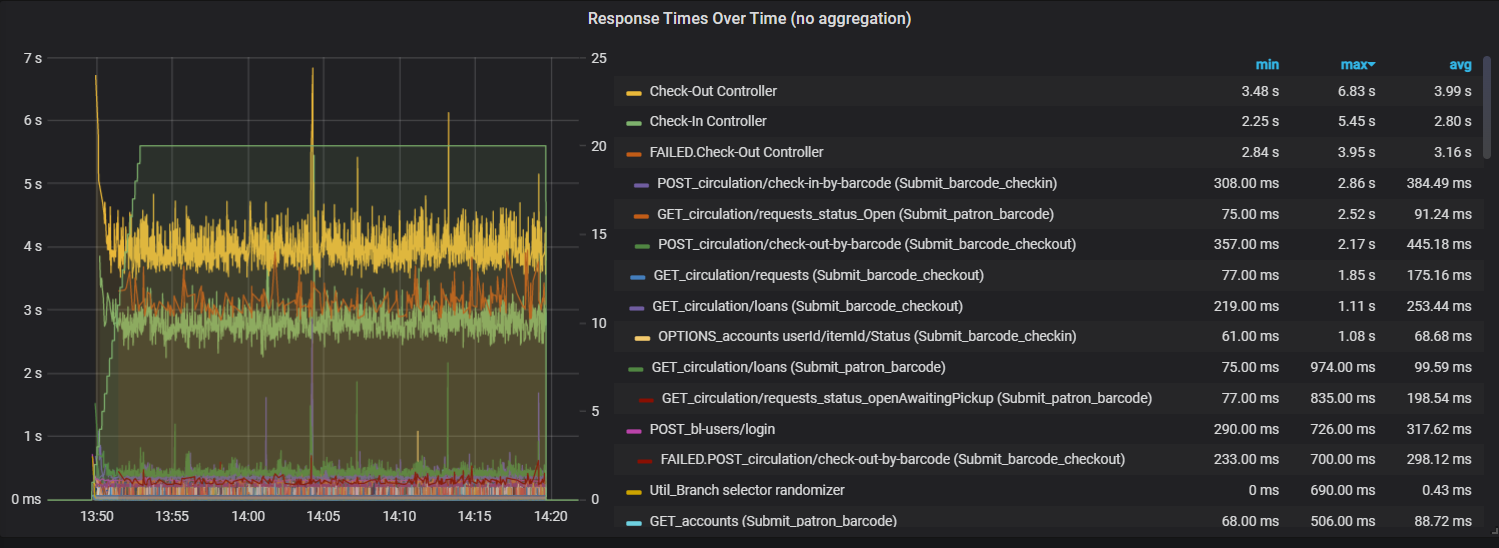
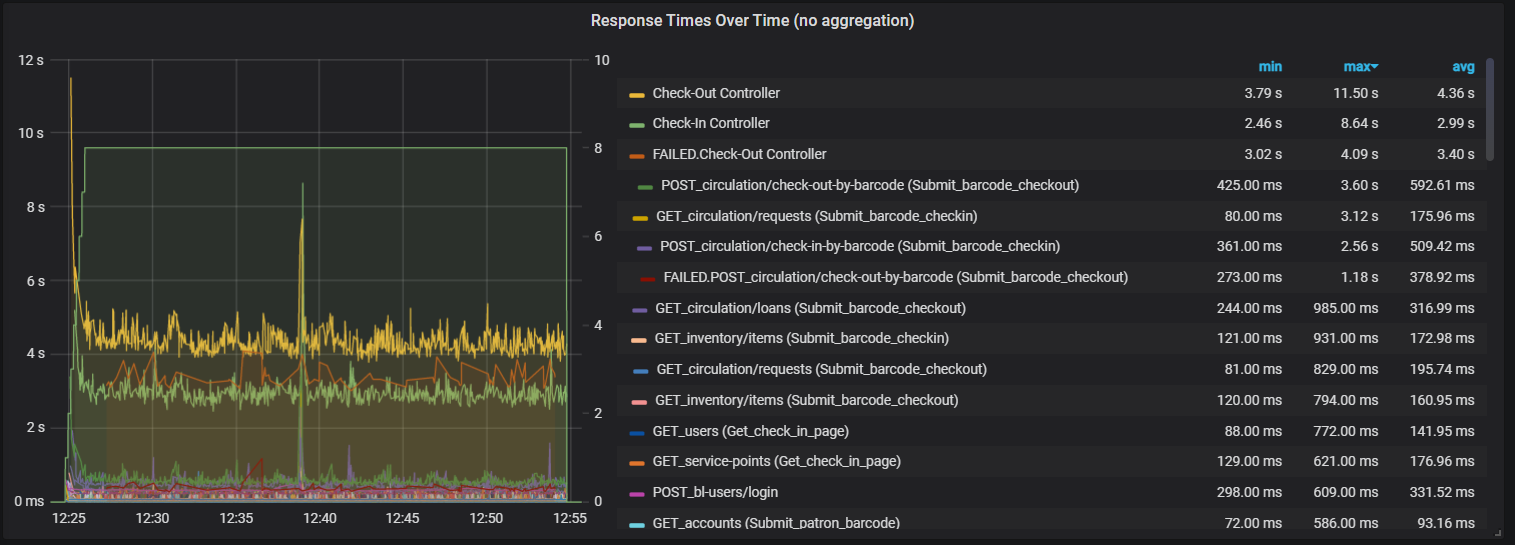
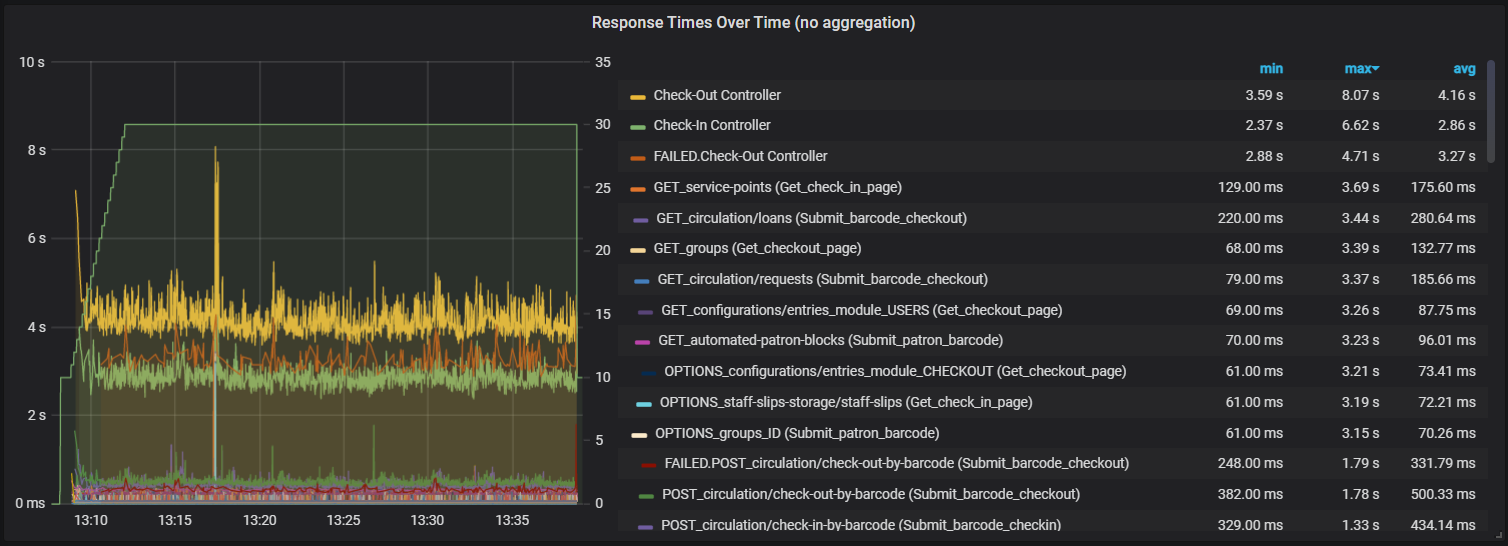
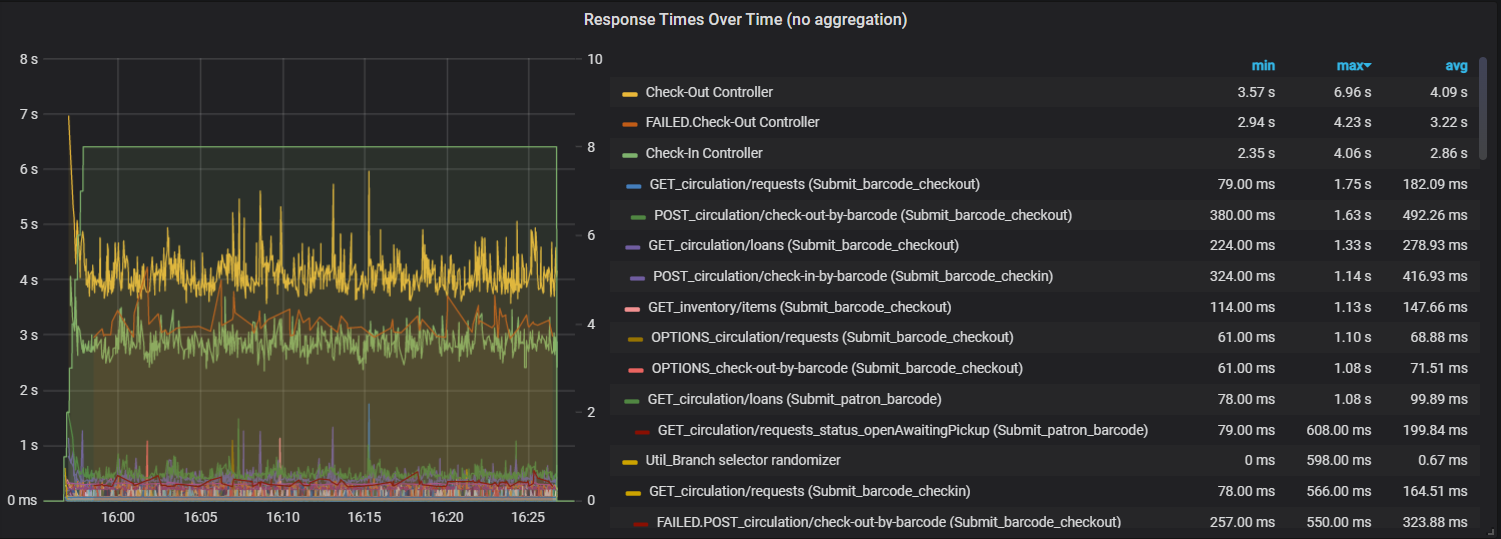
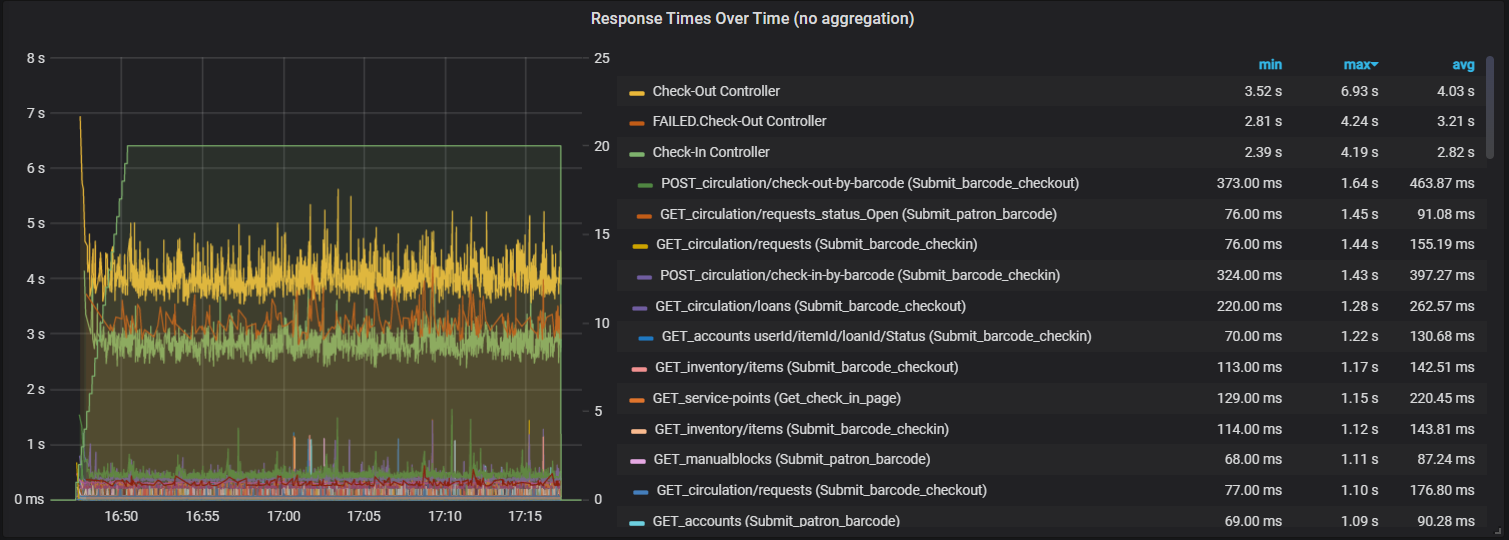
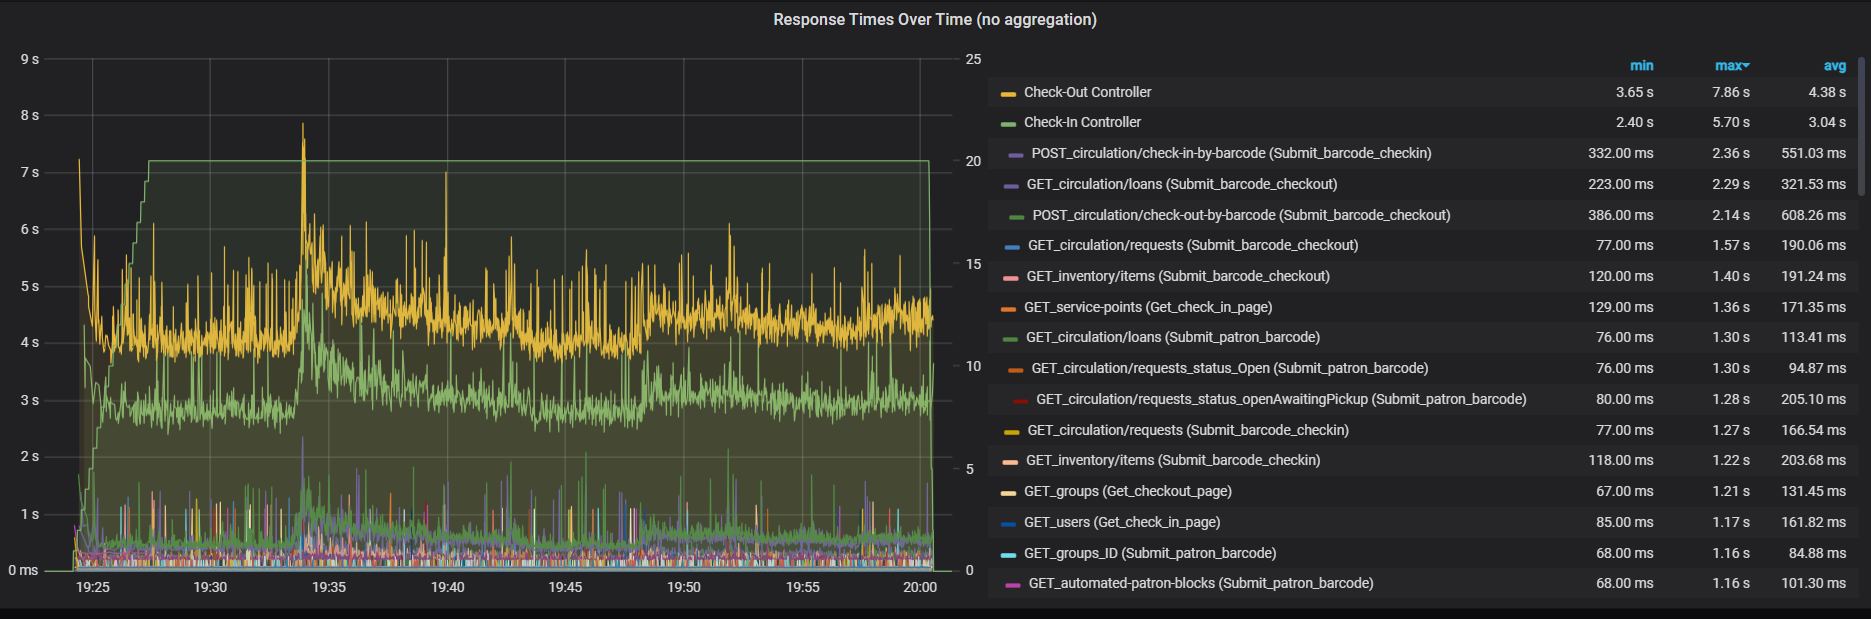
|---|---|---|---|---|
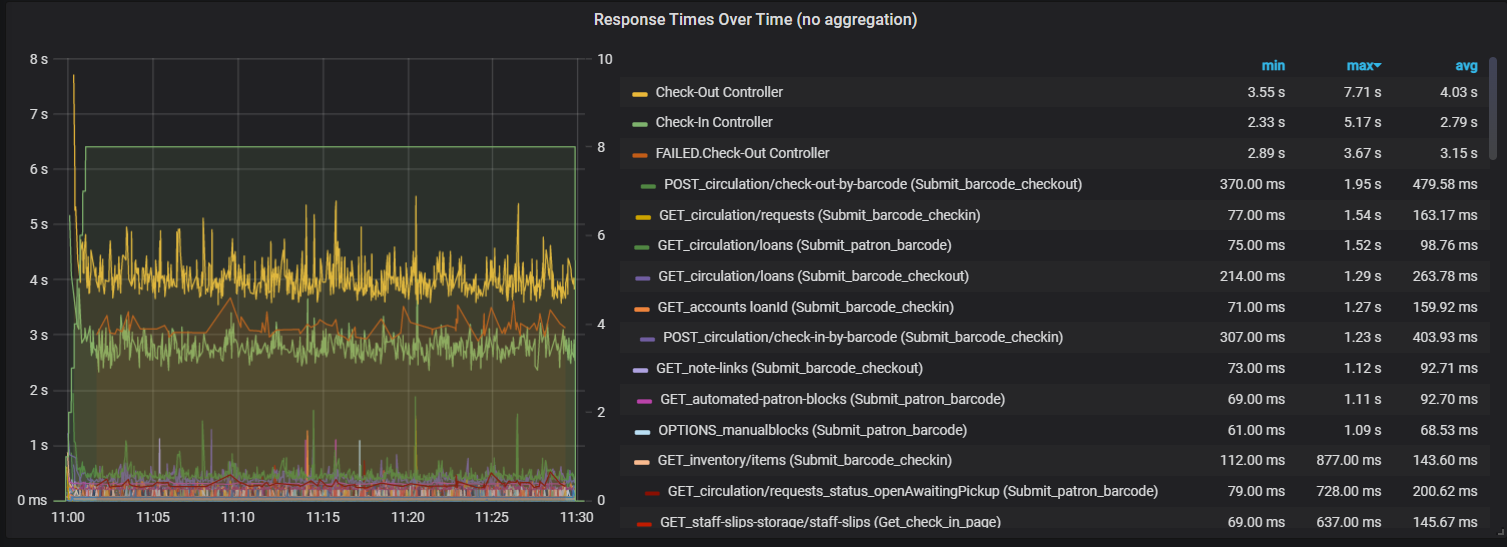
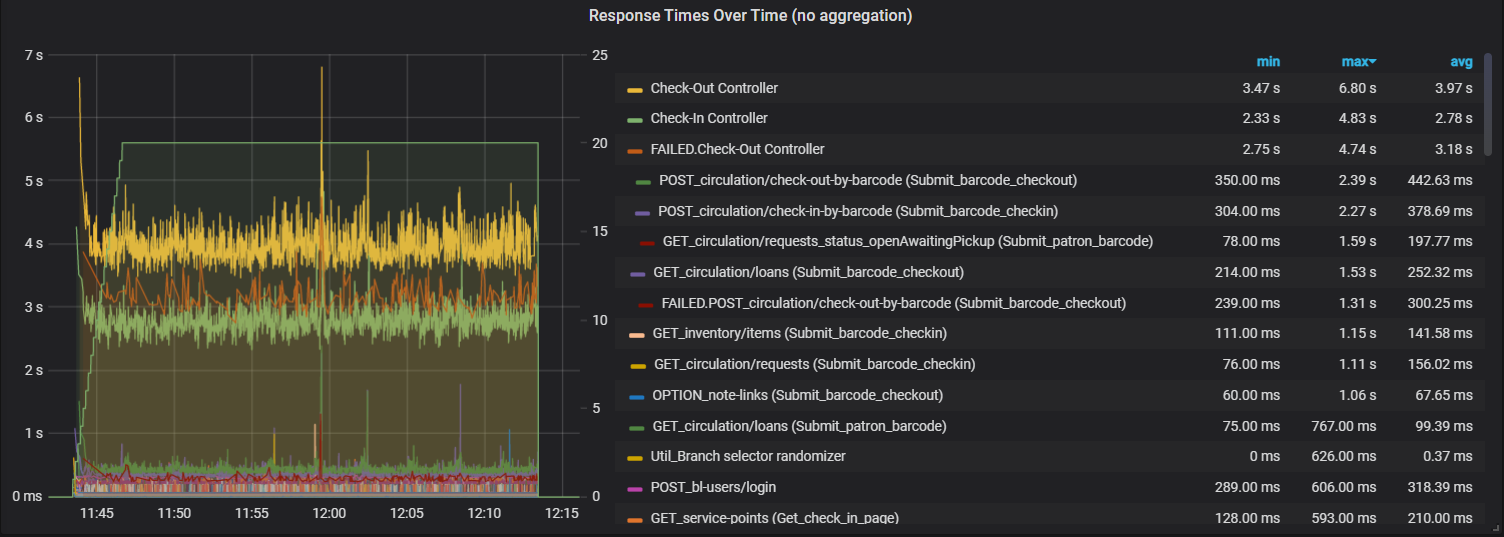
| Response Times Over Time | 8 users
20 users
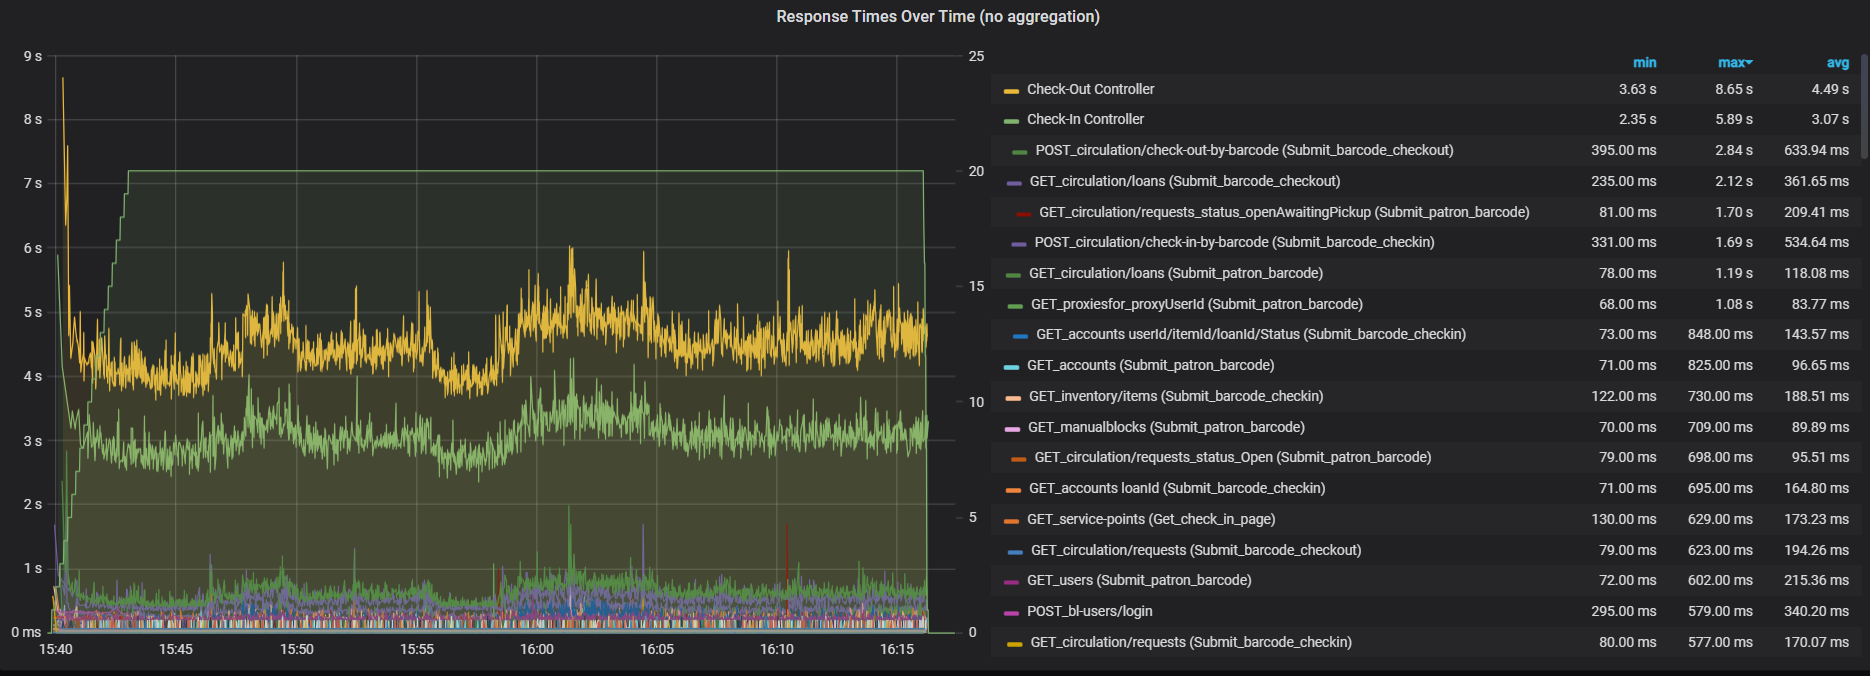
| 8 users
20 users
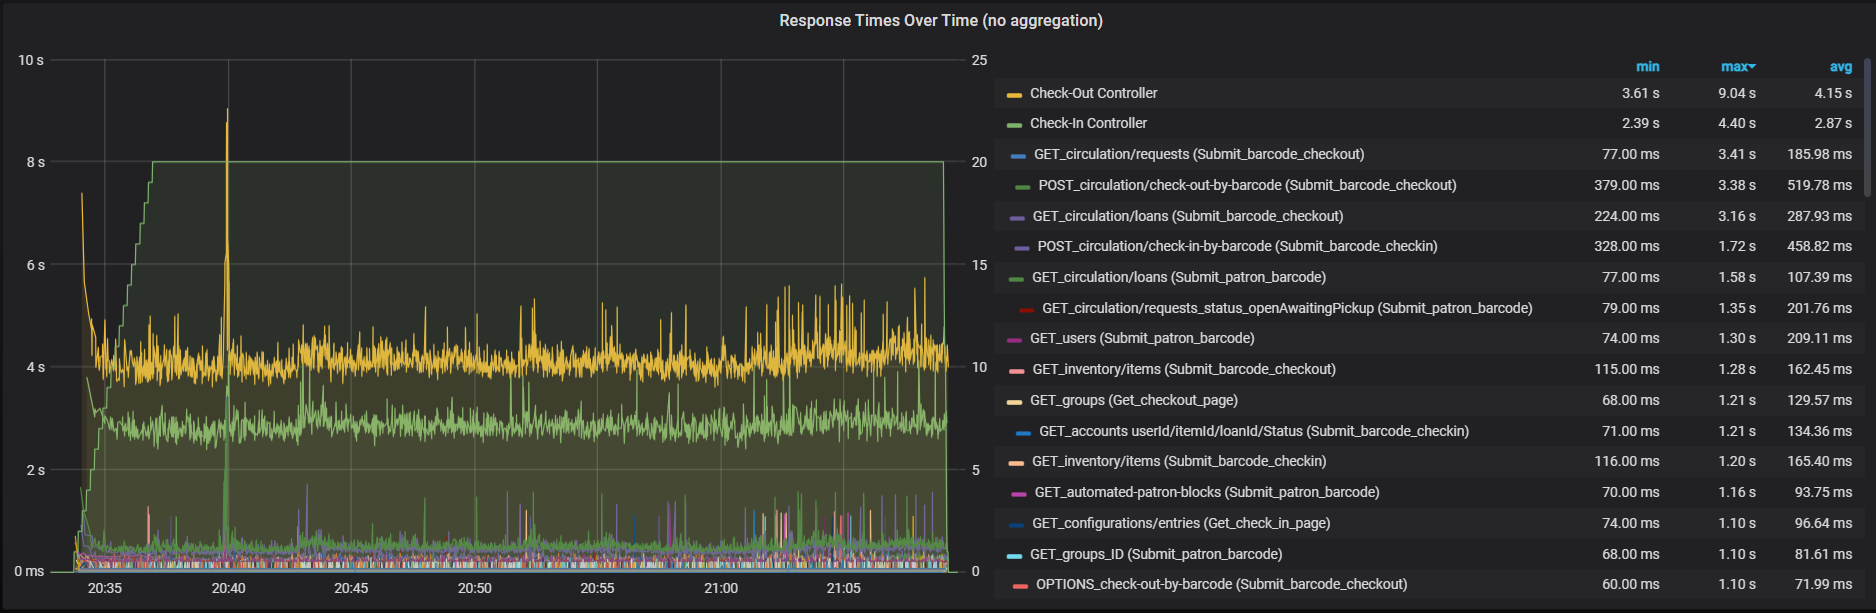
| 8 users
20 users
| 8 users
20 users
|
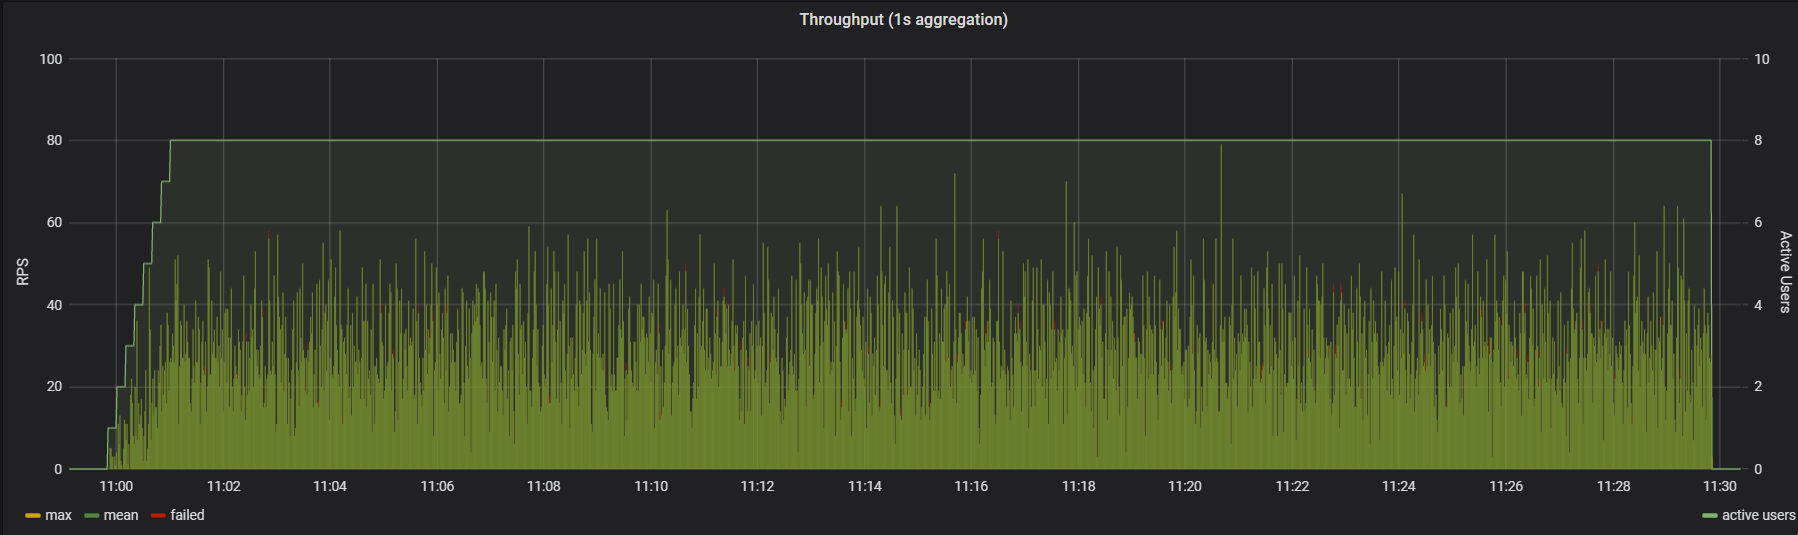
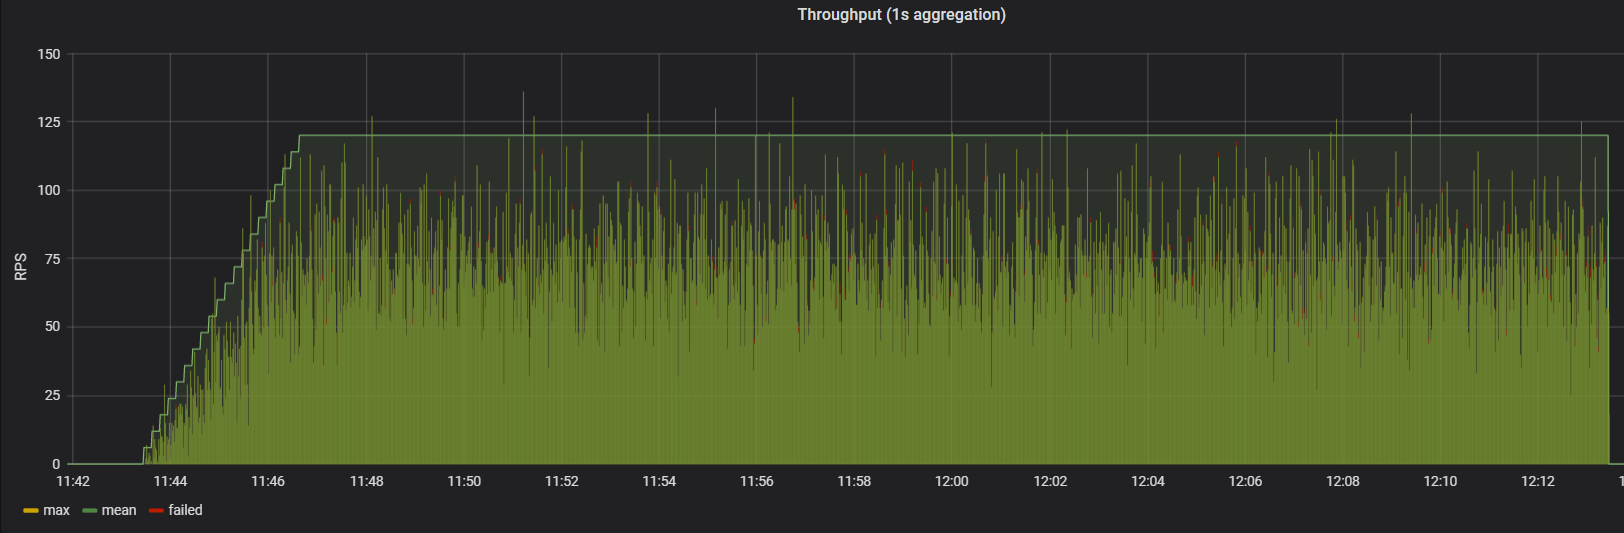
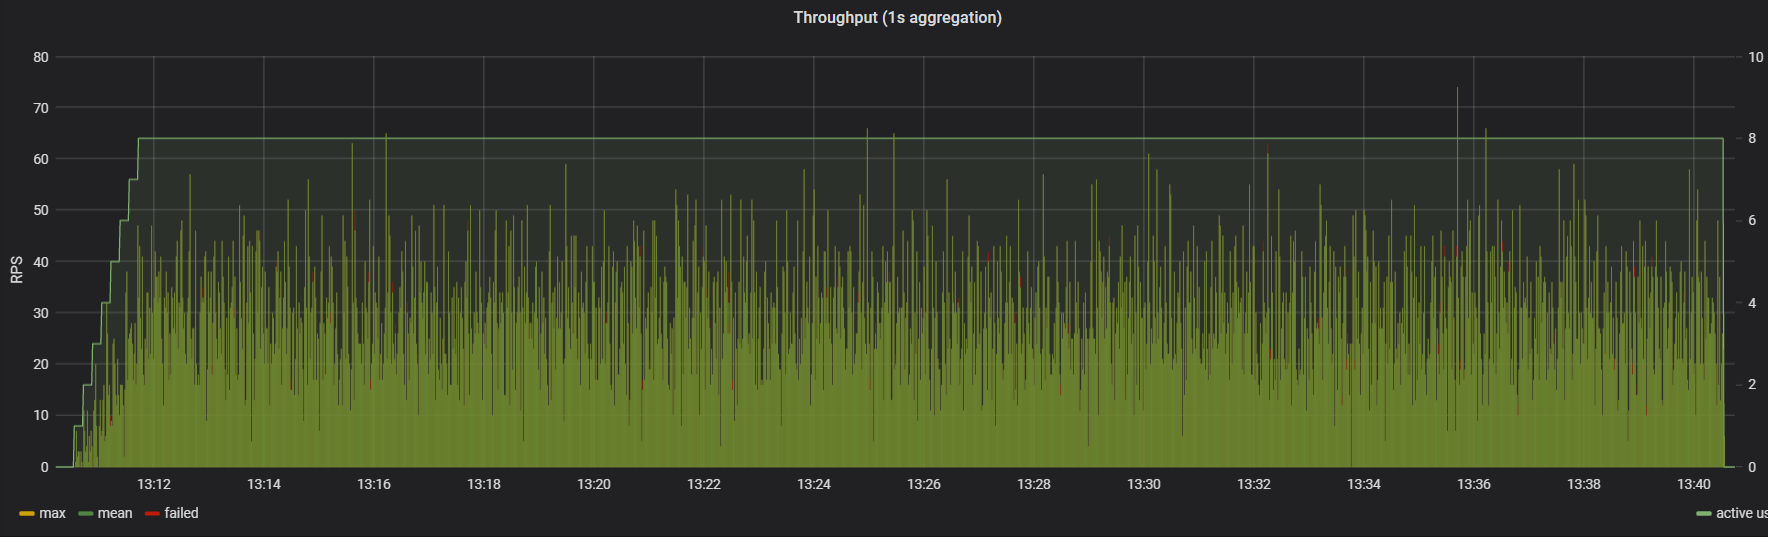
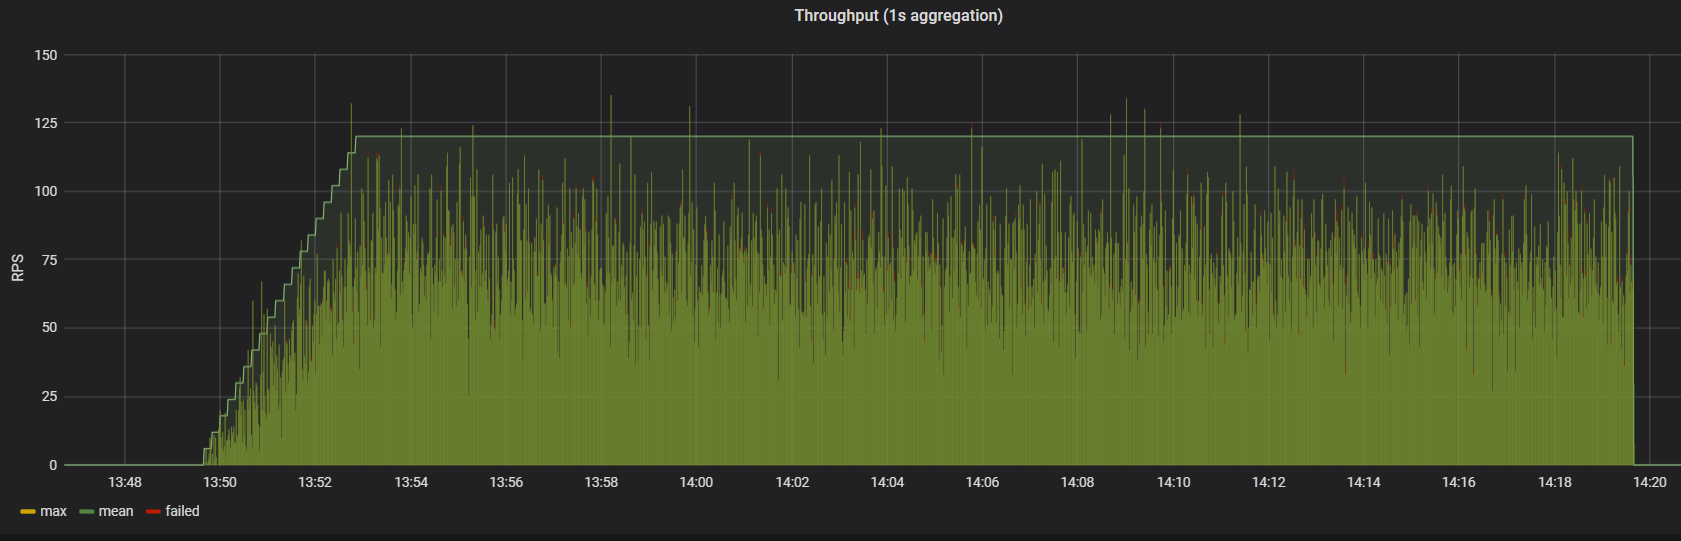
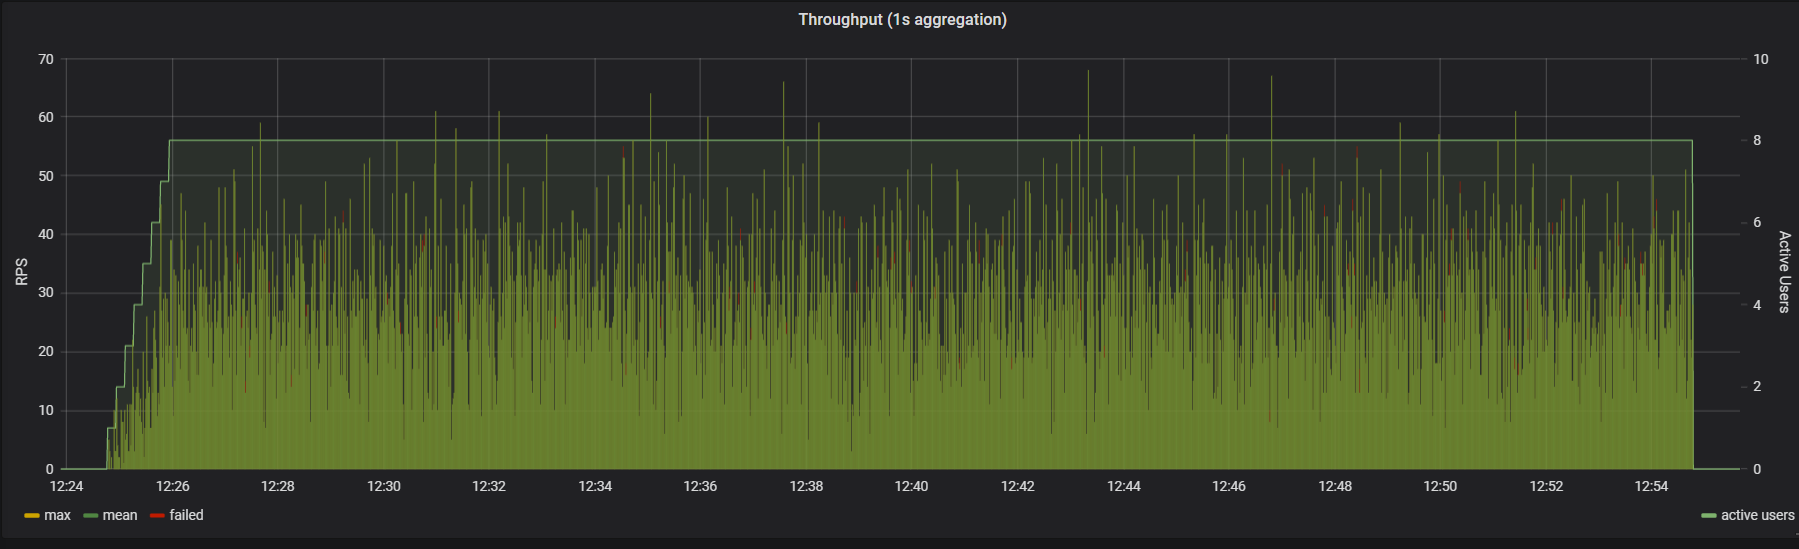
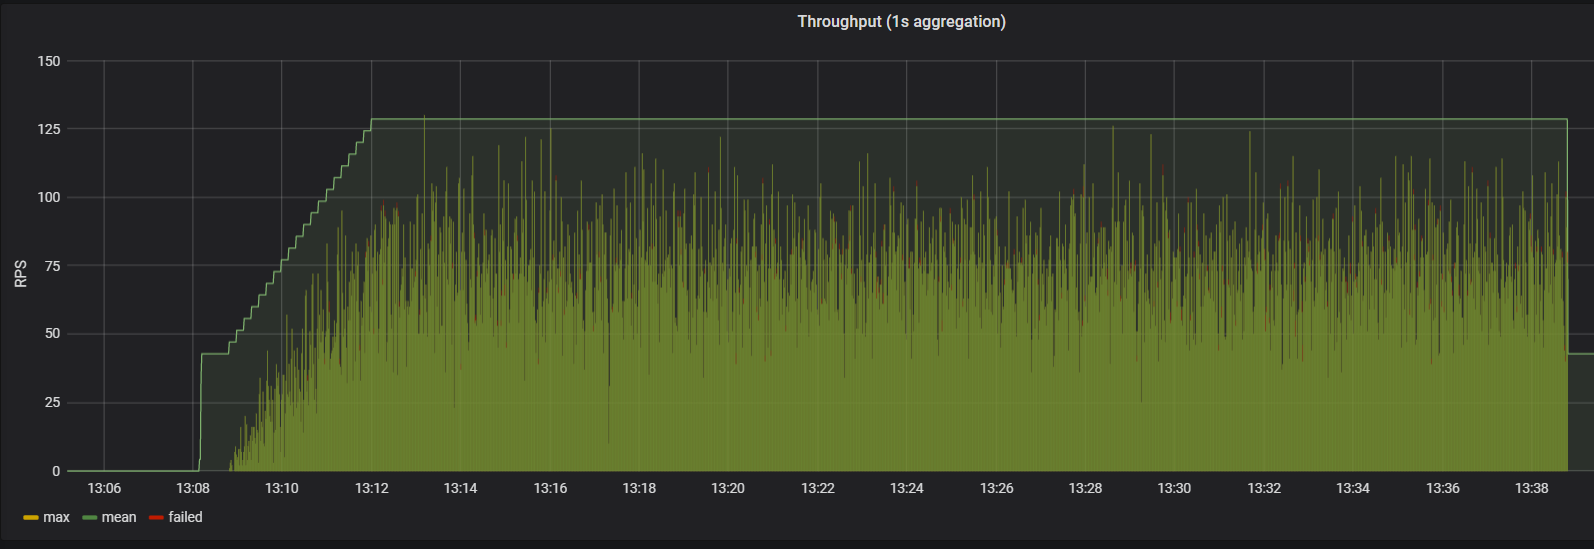
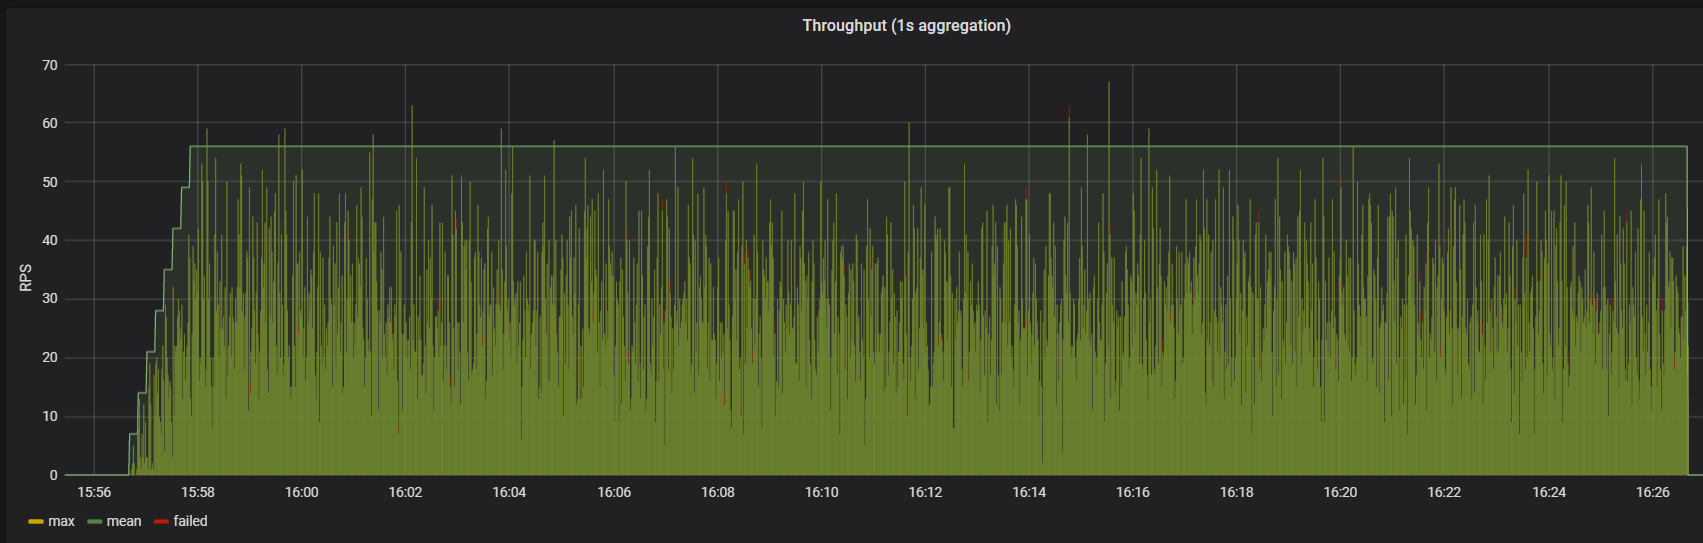
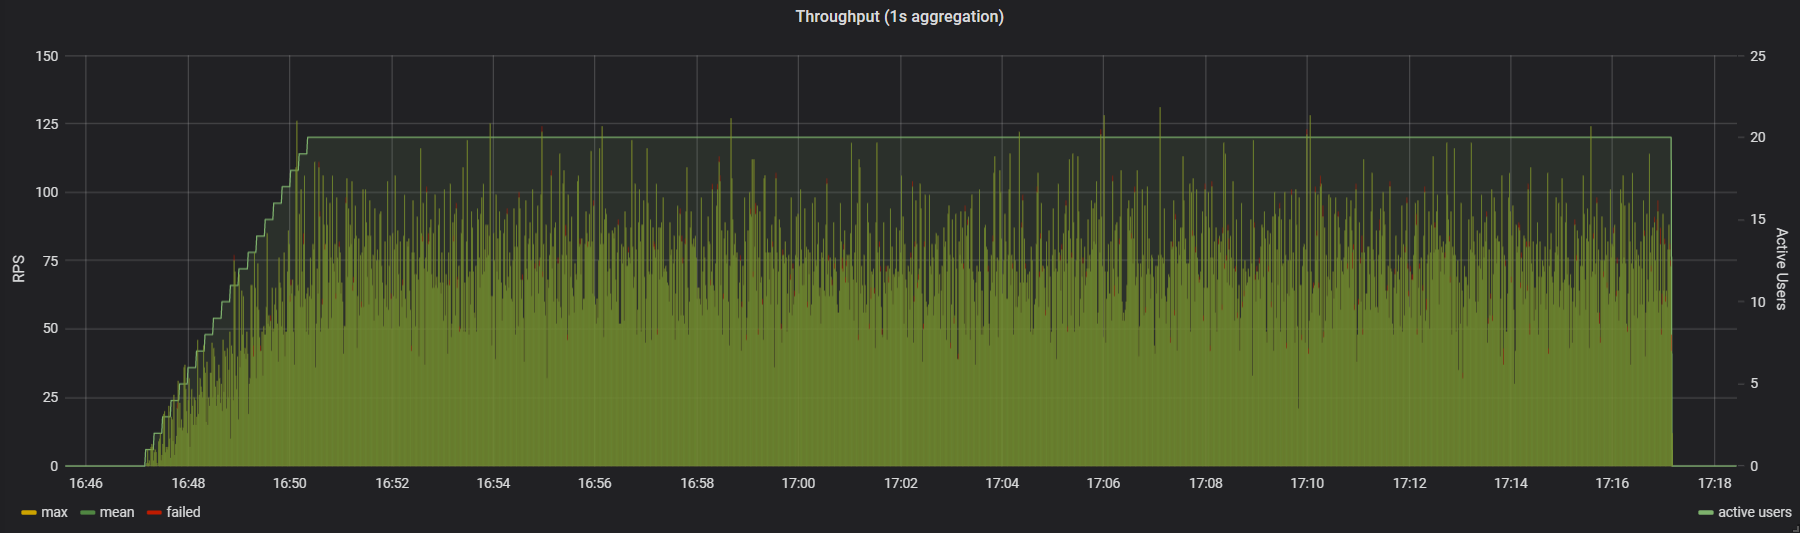
| Throughput | 8 users
20 users
| 8 users
20 users
| 8 users
20 users
| 8 users
20 users
|
| RDS CPU utilization | 8 users
20 users
| 8 users
20 users
| 8 users
20 users
| 8 users
20 users
|
| Service CPU utilization | 8 users
20 users
| 8 users
20 users
| 8 users
20 users
| 8 users
20 users
|
Summary table for CICO
| 8 users | 20 users | |||||||||||
| Requests | % KO | 75th pct | 95th pct | Average | Latency | % KO | 75th pct | 95th pct | Average | Latency | ||
| db.r6g.xlarge | Check-In Controller | 0 | 2.878 | 3.114 | 2.785 | 2.16 | 0 | 2.889 | 3.116 | 2.784 | 2.118 | |
| Check-Out Controller | 9.173 | 4.103 | 4.526 | 3.948 | 3.212 | 13.786 | 4.061 | 4.422 | 3.862 | 3.079 | ||
| db.r6g.8xlarge | Check-In Controller | 0 | 2.946 | 3.203 | 2.849 | 2.17 | 0 | 2.914 | 3.121 | 2.805 | 2.107 | |
| Check-Out Controller | 10.419 | 4.178 | 4.565 | 3.973 | 3.239 | 13.683 | 4.075 | 4.434 | 3.875 | 3.112 | ||
| Serverless v2 (0.5 - 128 ACUs) | Check-In Controller | 0 | 3.088 | 3.372 | 2.99 | 2.361 | 0 | 2.971 | 3.214 | 2.86 | 2.24 | |
| Check-Out Controller | 9.255 | 4.465 | 4.862 | 4.268 | 3.453 | 13.099 | 4.236 | 4.696 | 4.039 | 3.291 | ||
| Serverless v2 (32 - 128 ACUs) | Check-In Controller | 0 | 2.972 | 3.238 | 2.86 | 2.212 | 0 | 2.933 | 3.149 | 2.825 | 2.135 | |
| Check-Out Controller | 10.545 | 4.191 | 4.652 | 3.998 | 3.274 | 13.477 | 4.106 | 4.525 | 3.915 | 3.174 | ||
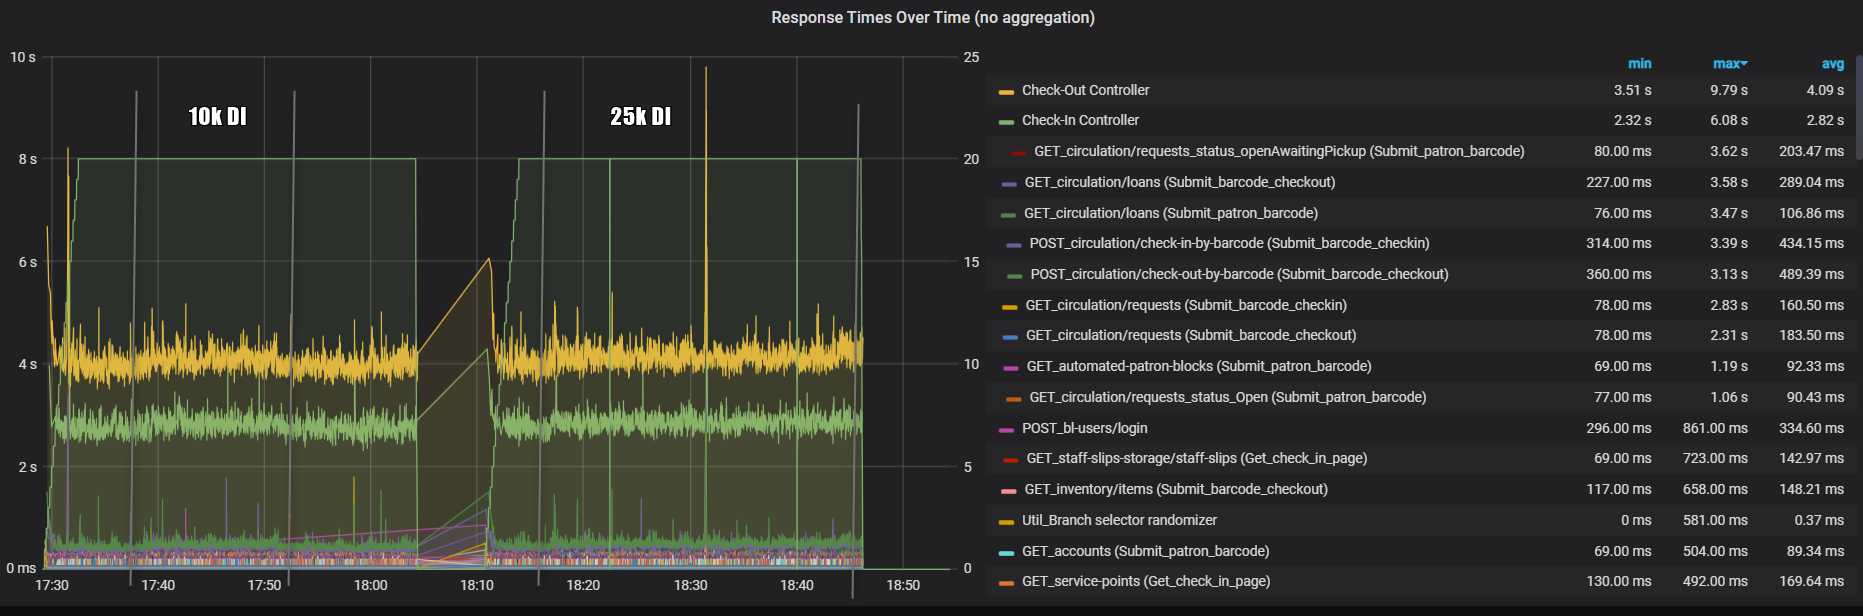
Comparison table for response times during 10k and 25k Data Import
Response times getting better for bigger files during DI. Delta shows difference in %.
| 10k DI | 25k DI | |||||||||||||||||
RDS (db.r6g.xlarge) | Serverless | delta, 75% | delta, 95% | RDS (db.r6g.xlarge) | Serverless | delta, 75% | delta, 95% | |||||||||||
| Requests | 75th pct | 95th pct | Average | 75th pct | 95th pct | Average | 75th pct | 95th pct | Average | 75th pct | 95th pct | Average | ||||||
| Check-In Controller | 3.218 | 3.71 | 3.138 | 3.347 | 3.867 | 3.118 | -4.01 | -4.23 | 3.249 | 3.665 | 3.076 | 3.134 | 3.398 | 2.99 | 3.54 | 7.29 | ||
| Check-Out Controller | 4.989 | 6.361 | 4.834 | 5.006 | 5.986 | 4.602 | -0.34 | 5.90 | 5.246 | 6.298 | 4.666 | 4.719 | 5.19 | 4.333 | 10.05 | 17.59 | ||
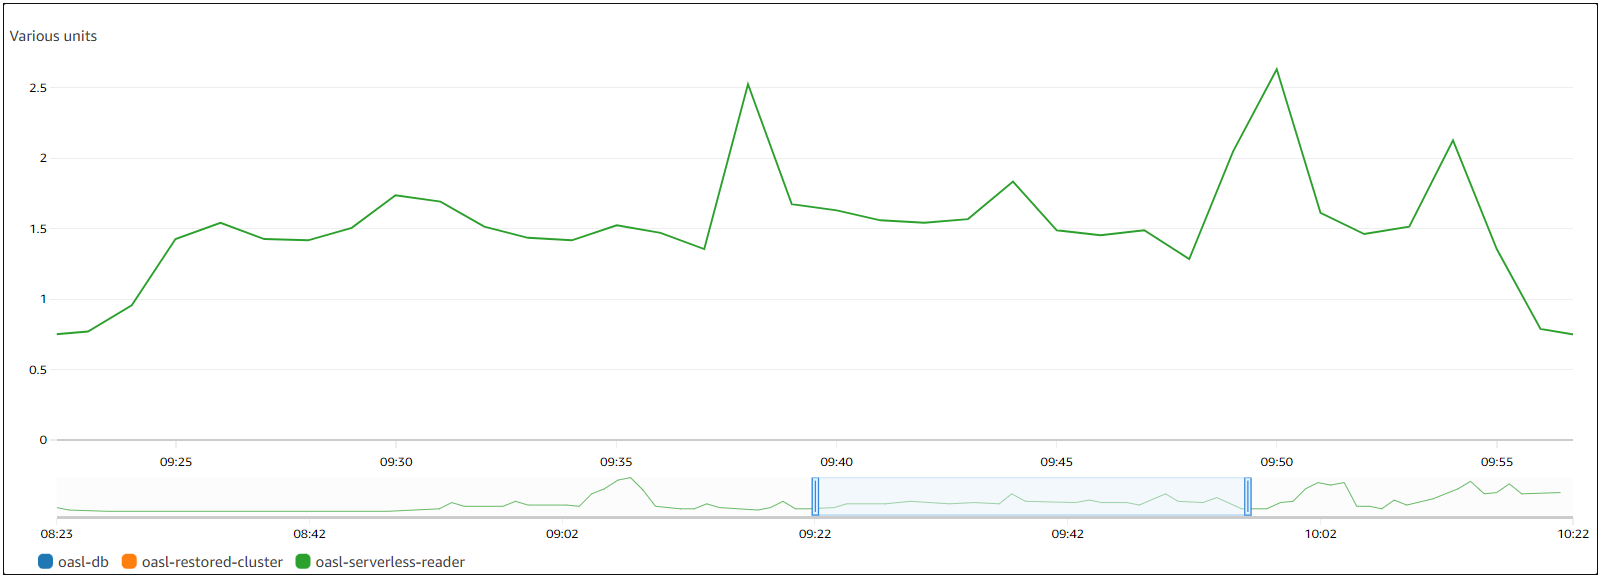
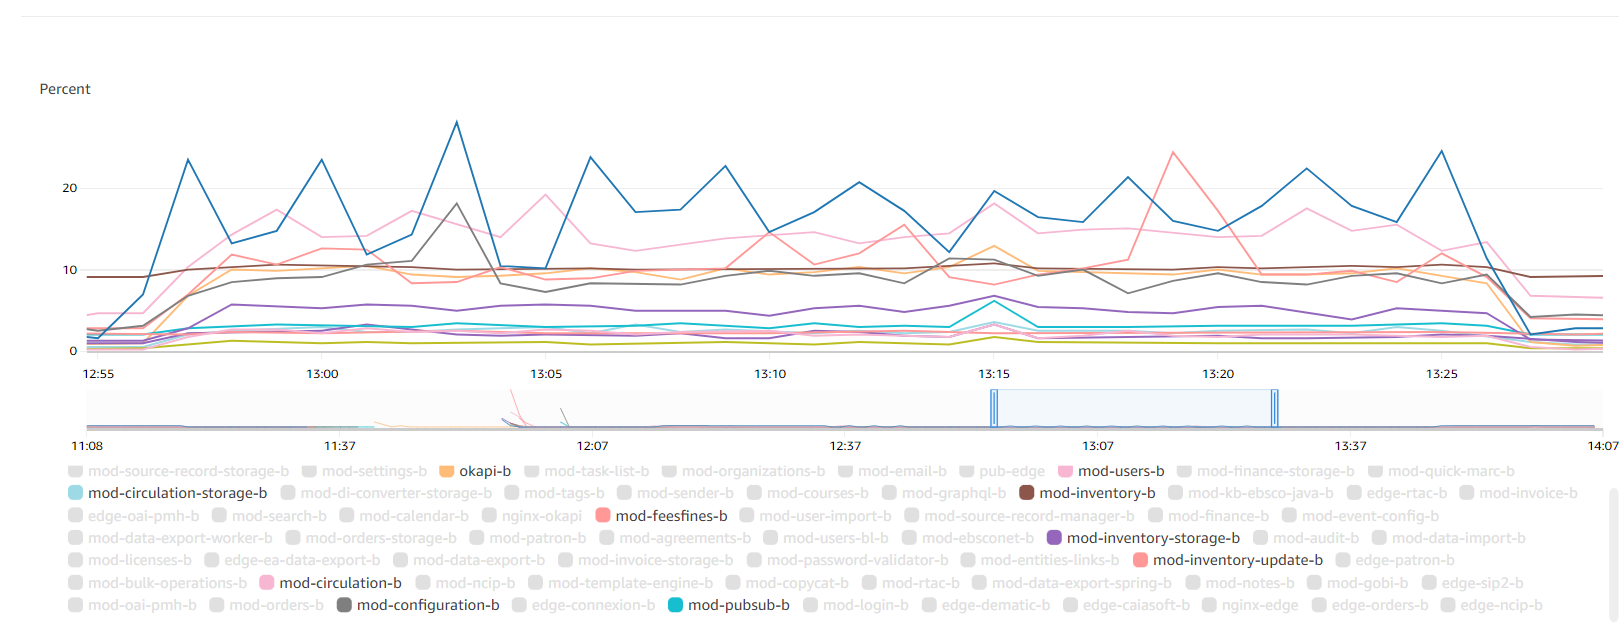
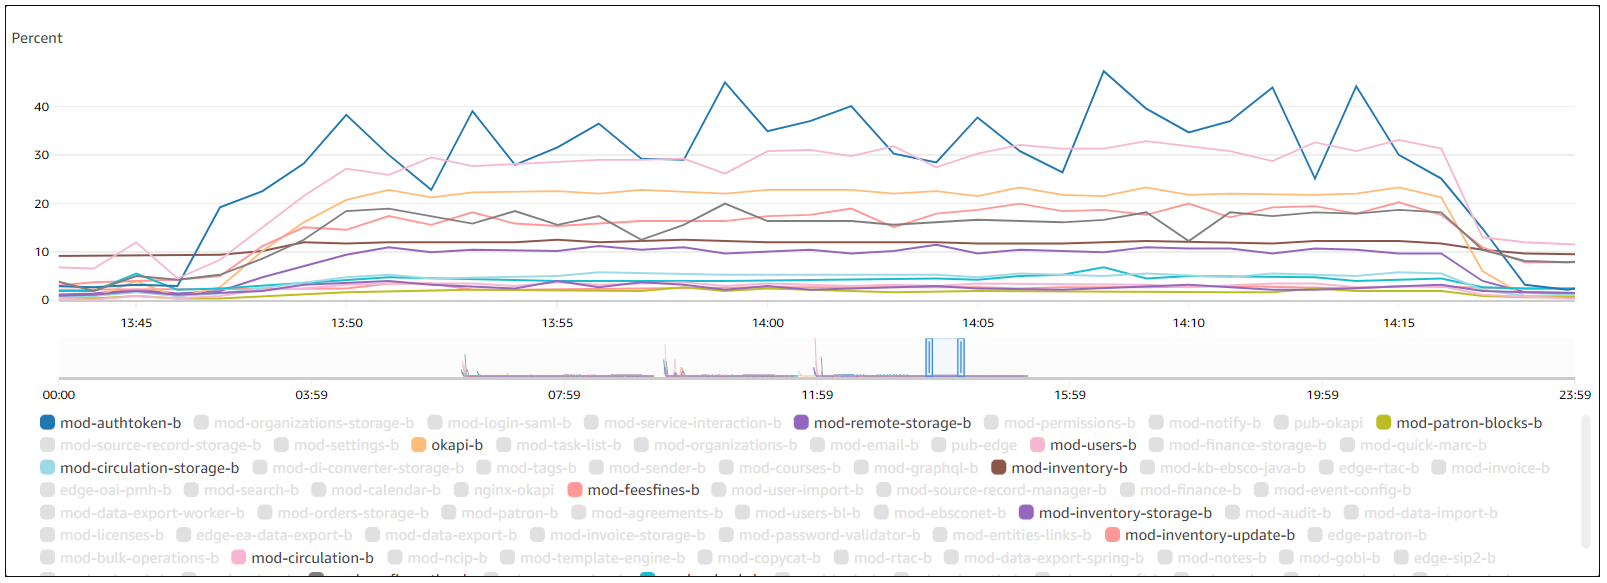
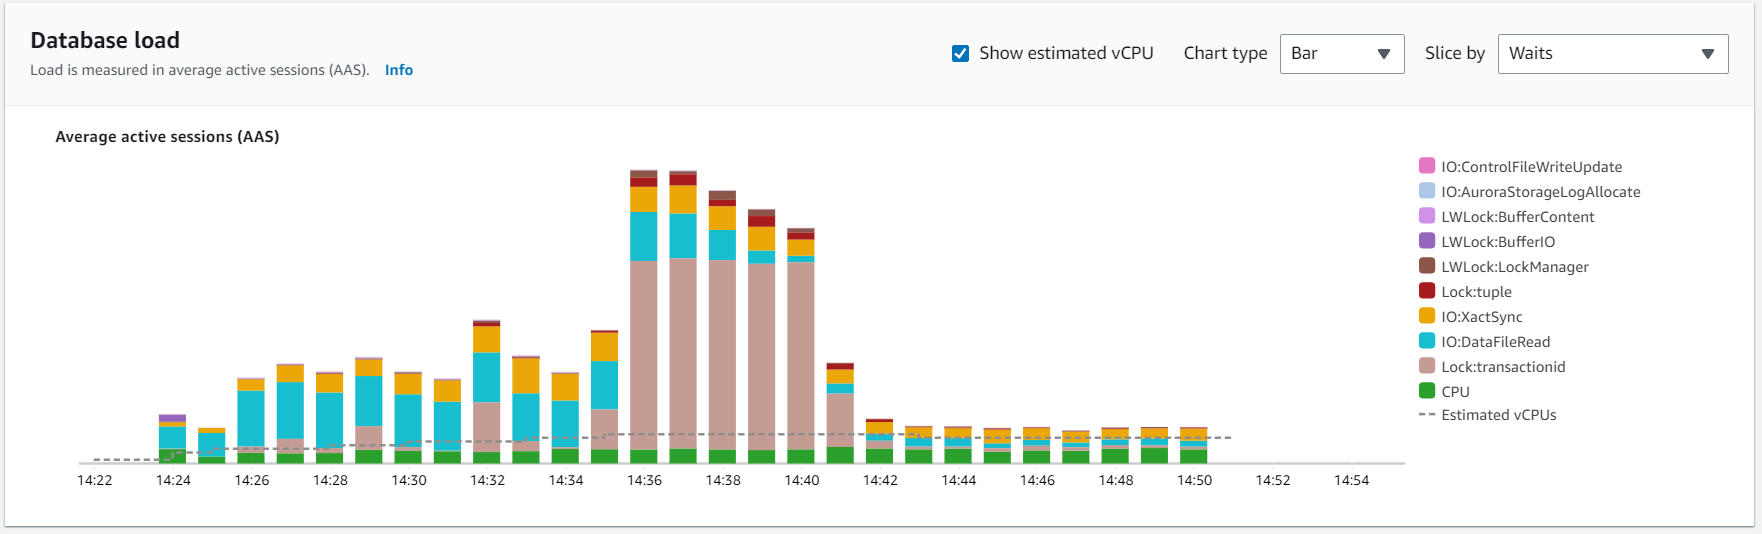
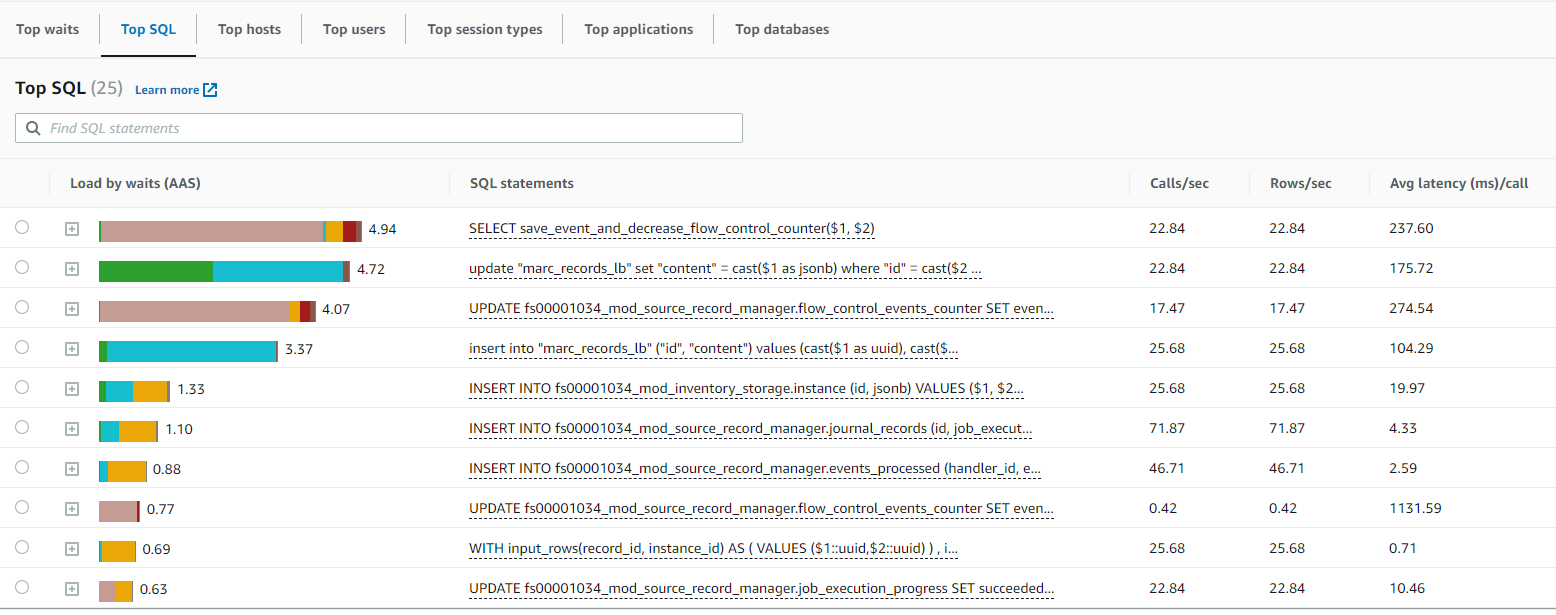
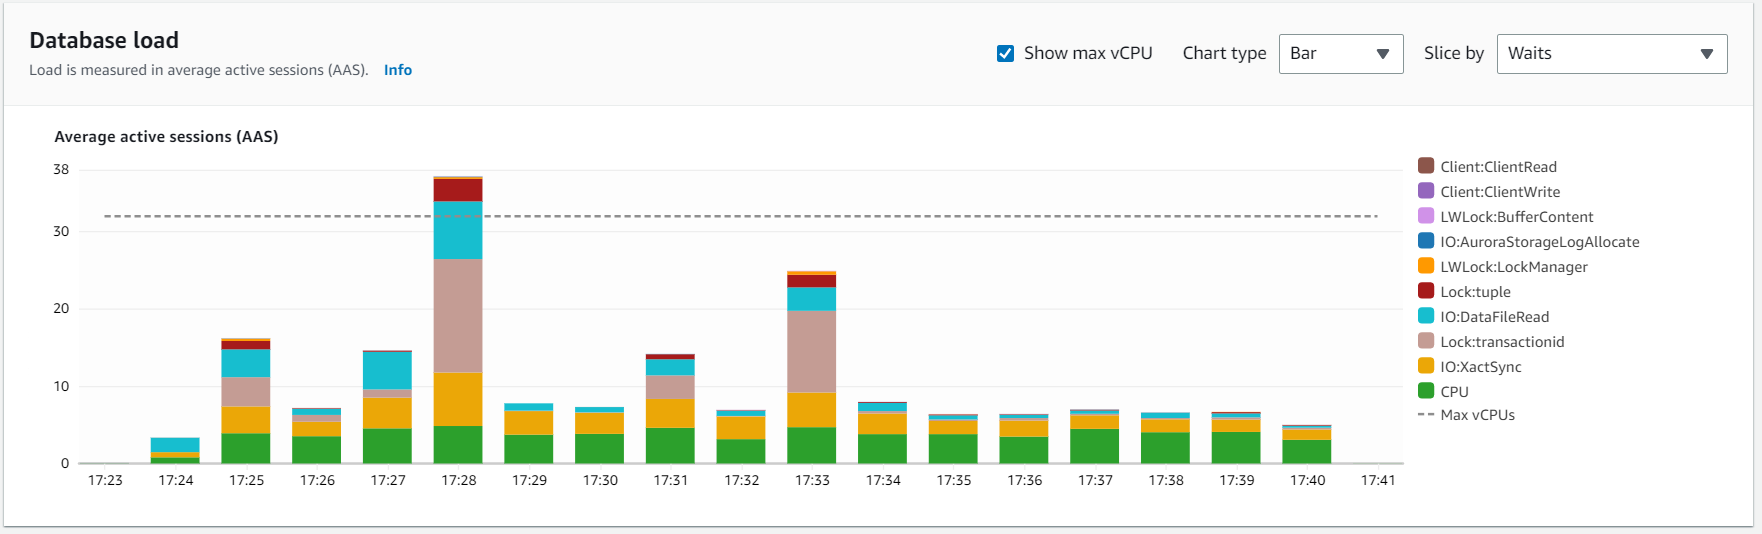
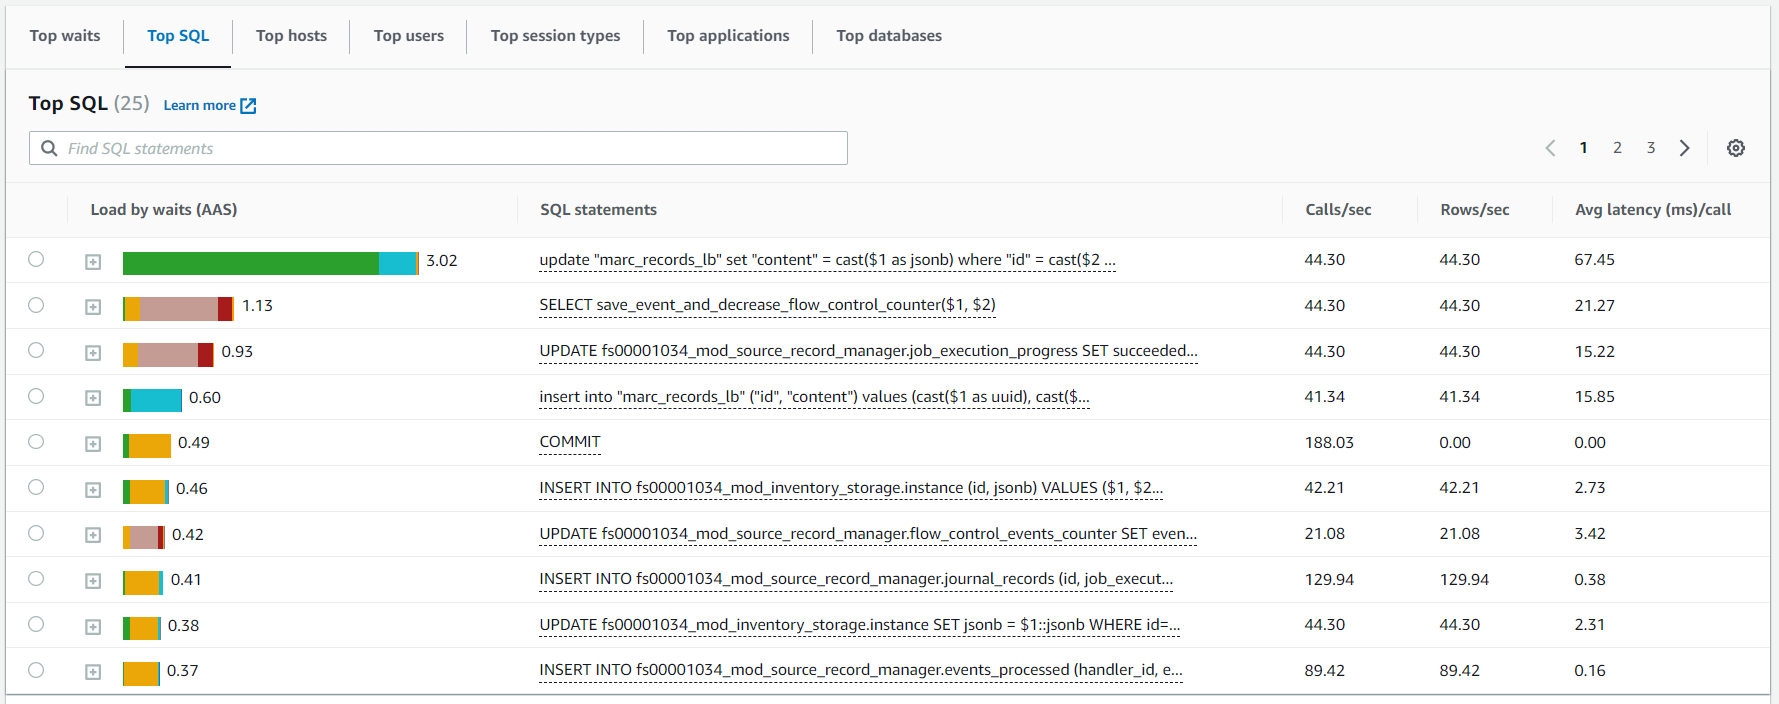
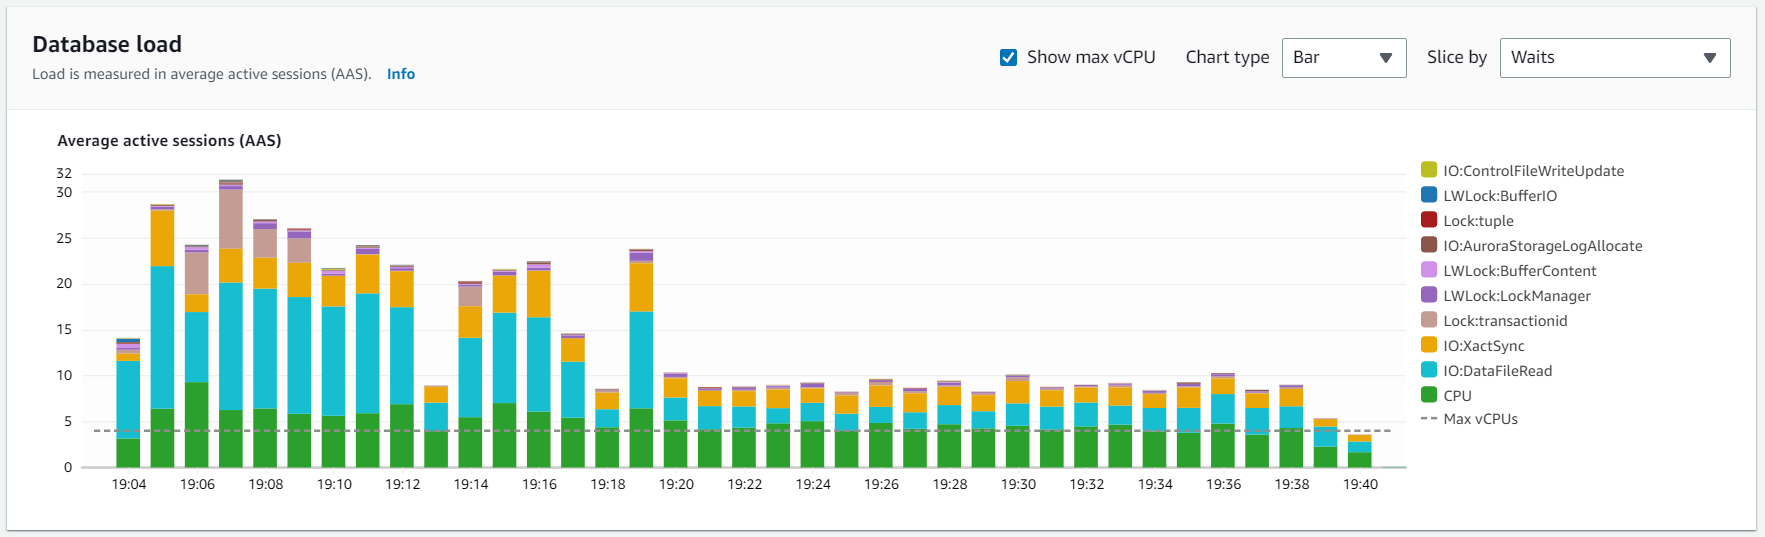
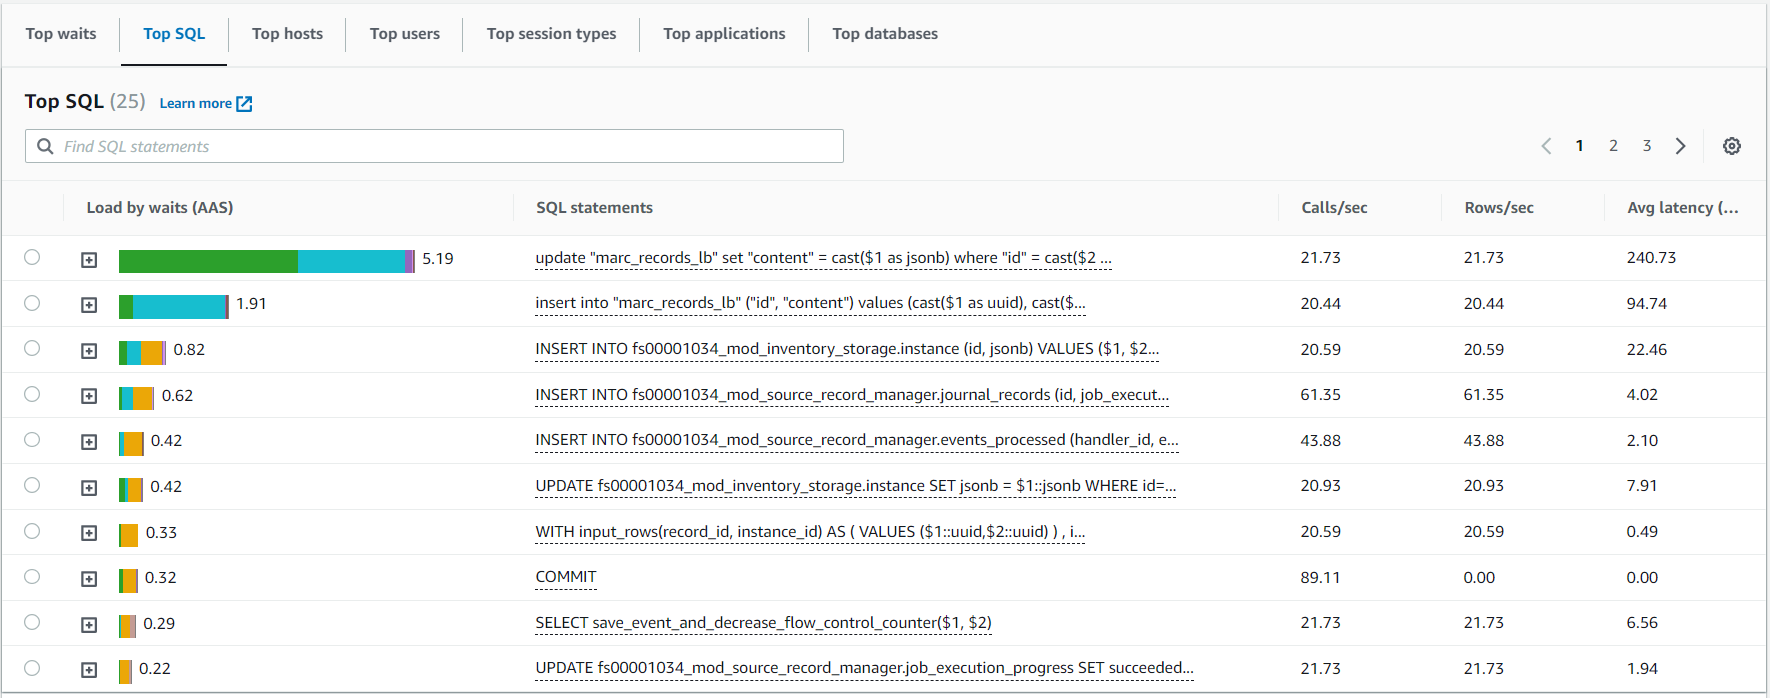
Average Active Sessions for DI with 50k file
To capture additional data from performance insights during DI with 50K file PERF-602 - Getting issue details... STATUS three DI operations for different DB instance types were carried out.
| Serverless v2 (0.5 - 128 ACUs) | RDS (db.r6g.8xlarge) | db.r6g.xlarge |
|---|---|---|
|
|
|
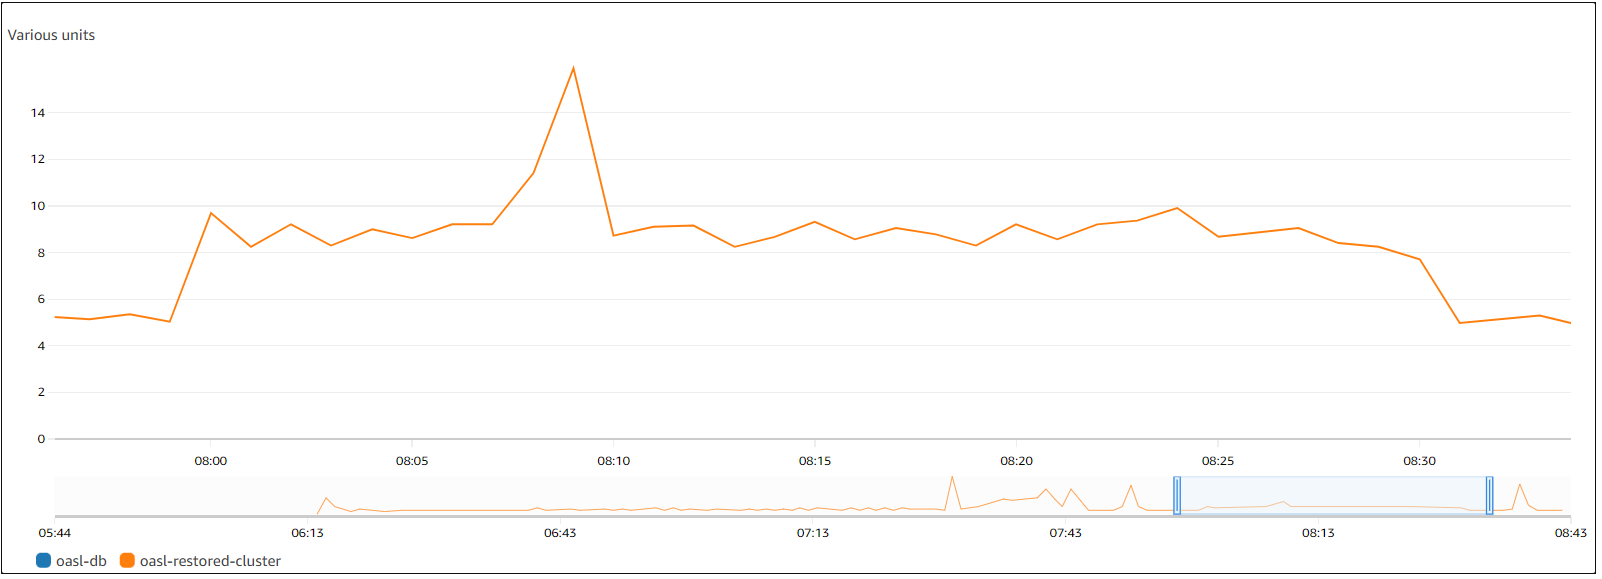
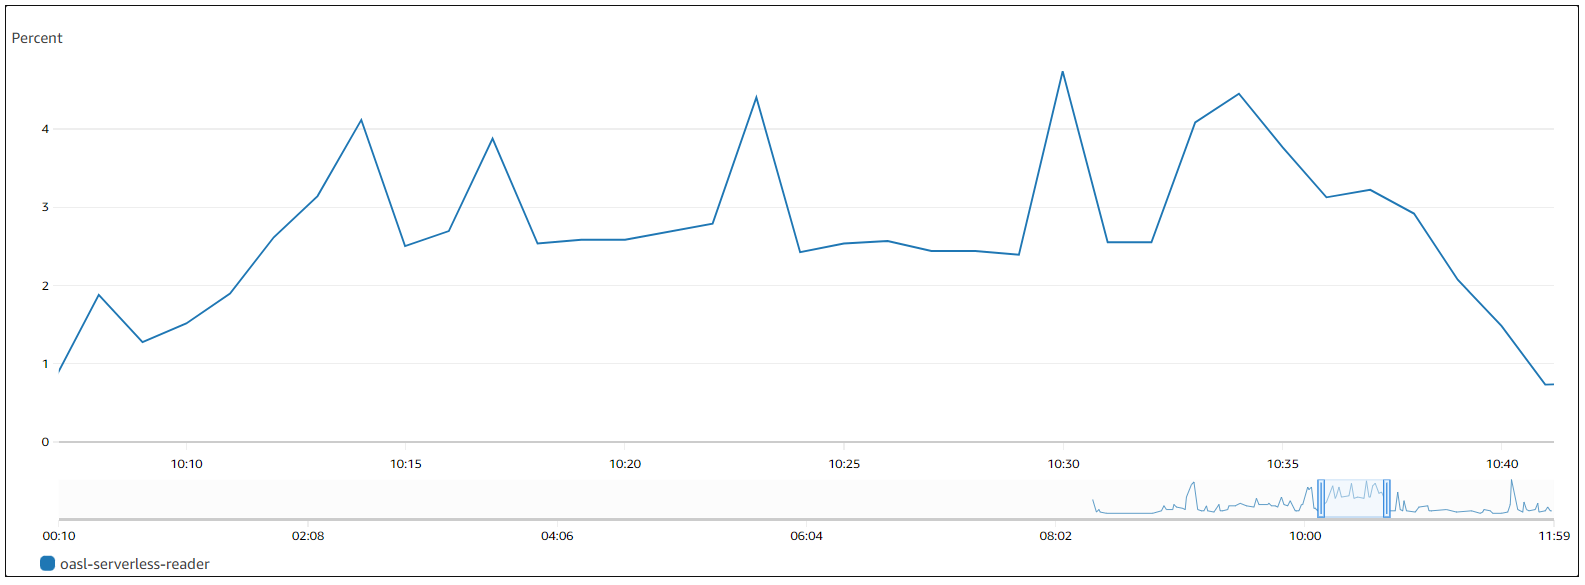
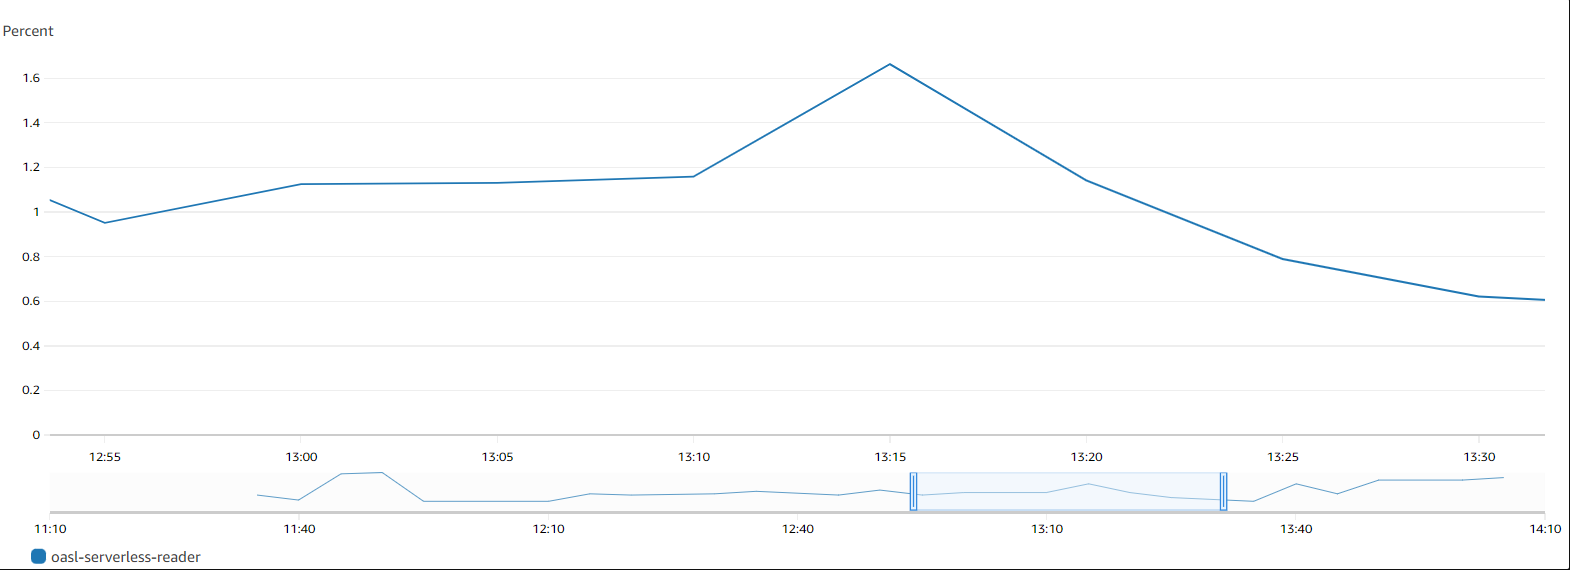
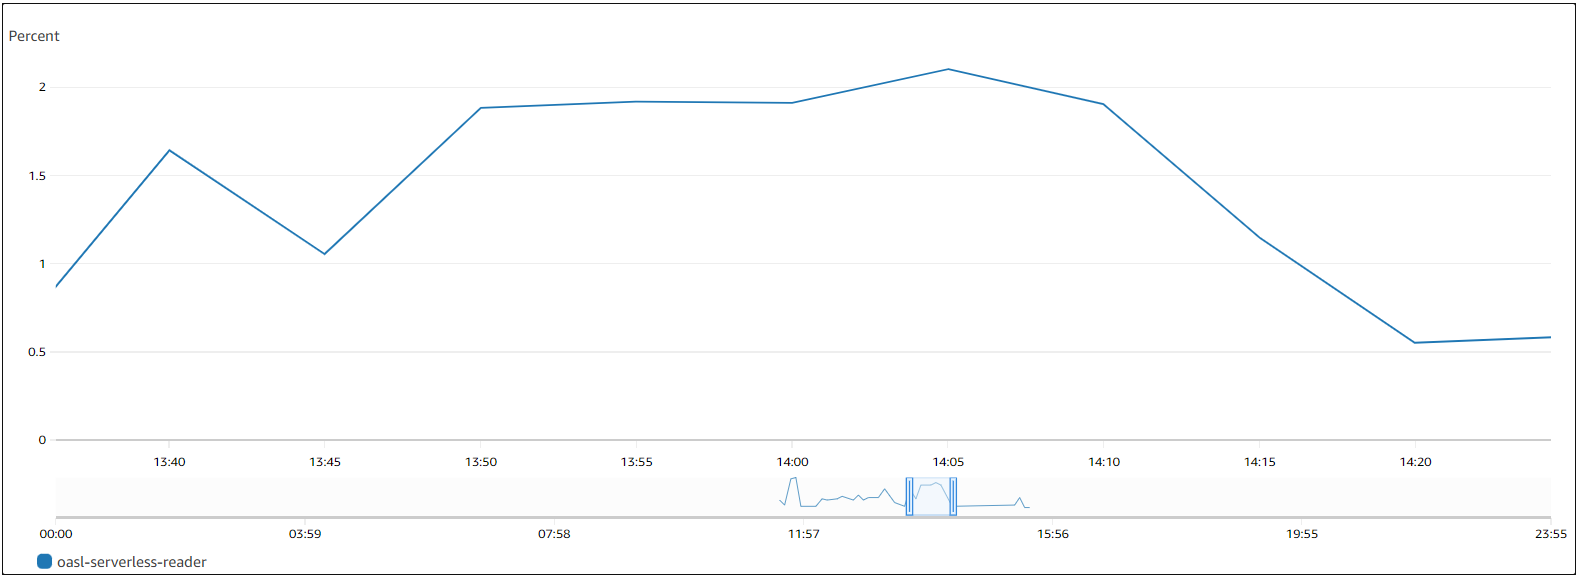
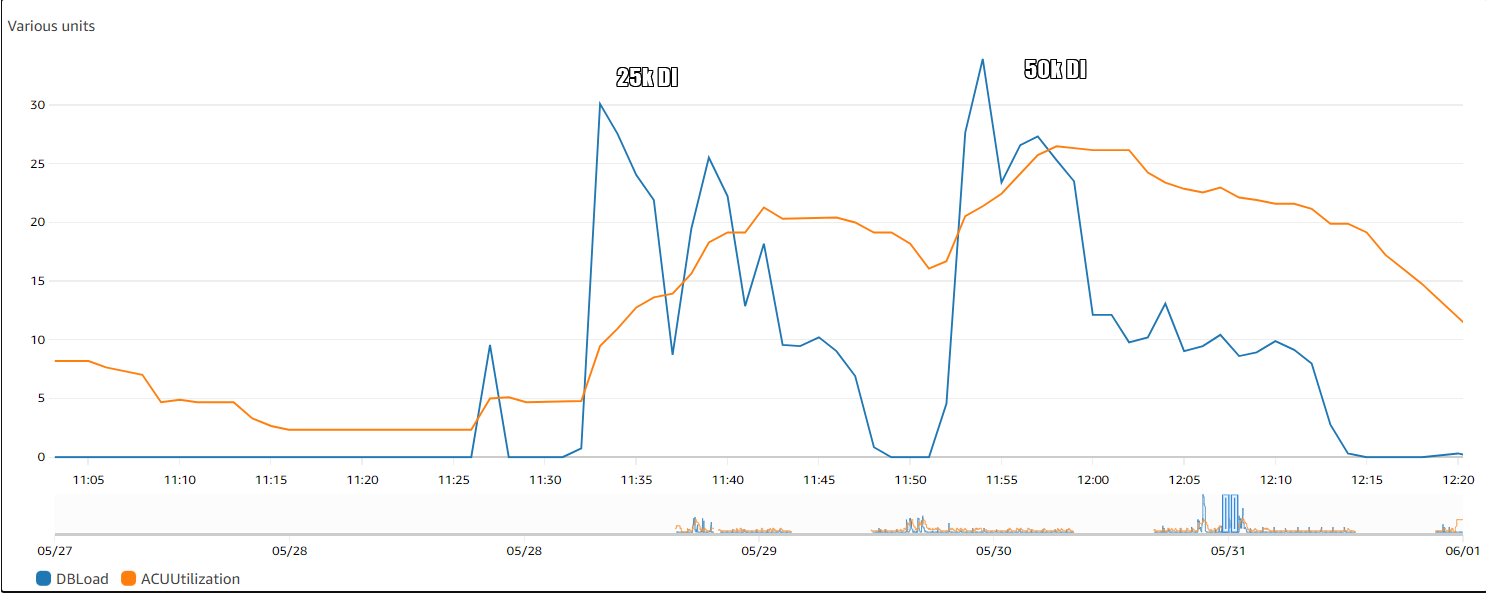
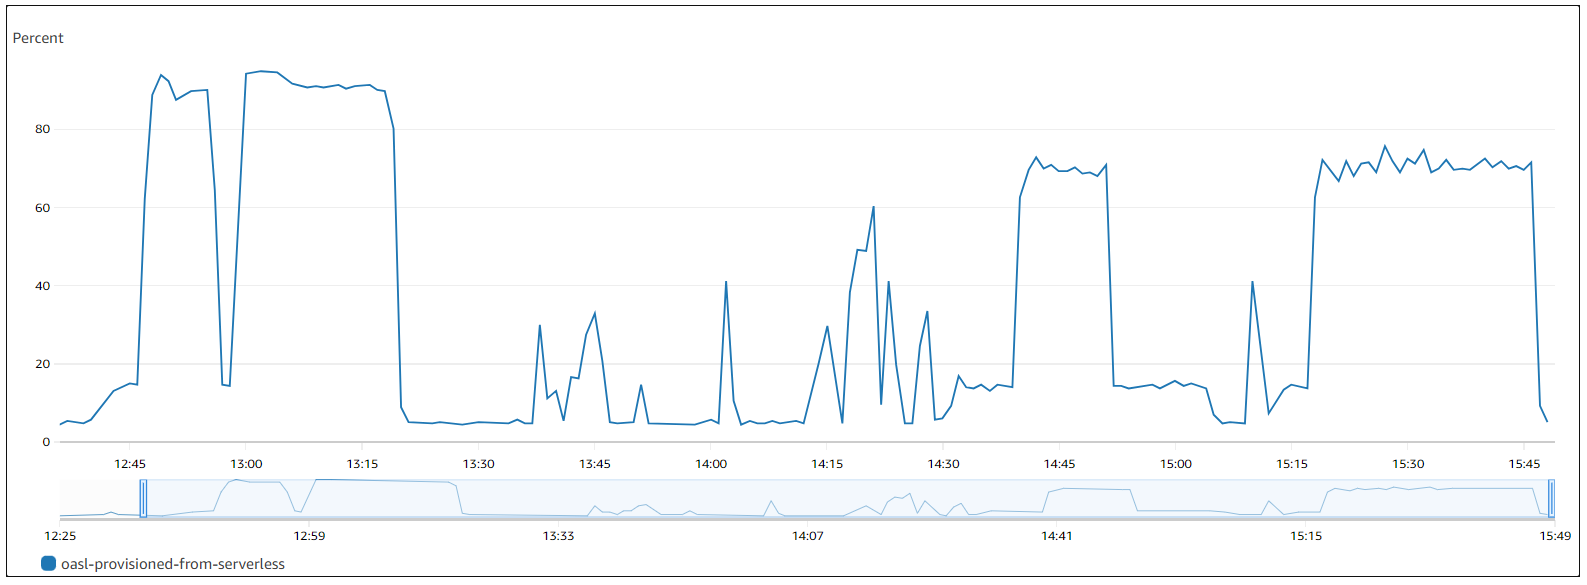
Example of growing ACUs for data import
Aurora Capacity Units |
|---|
| serverless |
Test date: 2023-05-31 ACUs grow in accordance with load and scale down without it gradually
|
Response times for all DB configurations
Error rate correlates with DI file size - it grows with bigger files. The lowest error rate was with Serverless during 25 DI. All errors are in Check-Out Controller for POST_circulation/check-out-by-barcode (Submit_barcode_checkout)_POST_422.
RDS db.r6g.8xlarge | All | Before 10K DI | During 10K DI | During 25K DI | After 25K DI | ||||||||||||||
|---|---|---|---|---|---|---|---|---|---|---|---|---|---|---|---|---|---|---|---|
| Requests | 75th pct | 95th pct | Average | 75th pct | 95th pct | Average | 75th pct | 95th pct | Average | 75th pct | 95th pct | Average | 75th pct | 95th pct | Average | ||||
| Check-In Controller | 2.901 | 3.103 | 2.792 | 2.866 | 3.128 | 2.772 | 2.936 | 3.232 | 2.827 | 2.933 | 3.138 | 2.815 | 2.893 | 3.064 | 2.764 | ||||
| Check-Out Controller | 4.255 | 4.767 | 3.956 | 4.212 | 4.6 | 4.017 | 4.333 | 4.728 | 4.088 | 4.352 | 4.787 | 4.065 | 4.259 | 4.731 | 3.902 | ||||
RDS db.r6g.xlarge | All | Before 10K DI | During 10K DI | During 25K DI | After 25K DI | ||||||||||||||||||||||||
| Requests | % KO | 75th pct | 95th pct | Average | Latency | % KO | 75th pct | 95th pct | Average | Latency | % KO | 75th pct | 95th pct | Average | Latency | % KO | 75th pct | 95th pct | Average | Latency | % KO | 75th pct | 95th pct | Average | Latency | ||||
| Check-In Controller | 0 | 3.053 | 3.472 | 2.942 | 2.506 | 0 | 2.904 | 3.2 | 2.837 | 2.199 | 0 | 3.218 | 3.71 | 3.138 | 2.726 | 0 | 3.249 | 3.67 | 3.076 | 2.672 | 0 | 2.952 | 3.17 | 2.856 | 2.242 | ||||
| Check-Out Controller | 43.379 | 4.656 | 5.824 | 4.284 | 4.343 | 9.188 | 4.322 | 4.9 | 4.205 | 3.474 | 16.061 | 4.989 | 6.36 | 4.834 | 4.914 | 36.691 | 5.246 | 6.3 | 4.666 | 4.841 | 67.369 | 4.271 | 4.83 | 3.935 | 3.427 | ||||
Serverless | Before 10K DI | During 10K DI | During 25K DI | After 25K DI | |||||||||||||||||||
| Requests | % KO | 75th pct | 95th pct | Average | Latency | % KO | 75th pct | 95th pct | Average | Latency | % KO | 75th pct | 95th pct | Average | Latency | % KO | 75th pct | 95th pct | Average | Latency | |||
| Check-In Controller | 0 | 2.992 | 3.315 | 2.888 | 2.33 | 0 | 3.347 | 3.867 | 3.118 | 2.854 | 0 | 3.134 | 3.398 | 2.99 | 2.45 | 0 | 2.961 | 3.164 | 2.85 | 2.237 | |||
| Check-Out Controller | 13.753 | 4.382 | 4.923 | 4.176 | 3.481 | 15.459 | 5.006 | 5.986 | 4.602 | 4.506 | 27.453 | 4.719 | 5.19 | 4.333 | 3.786 | 61.16 | 4.351 | 4.892 | 3.984 | 3.461 | |||
* Due to high error rate a new set of CICO DI tests were carried out with new job profiles for Create and Update (PTF - Create 2, PTF - Updates Success - 1).
CICO DI Create + Update
Serverless | db.r6g.xlarge | |
|---|---|---|
| Response Times Over Time | Create
Update
| Create
Update
|
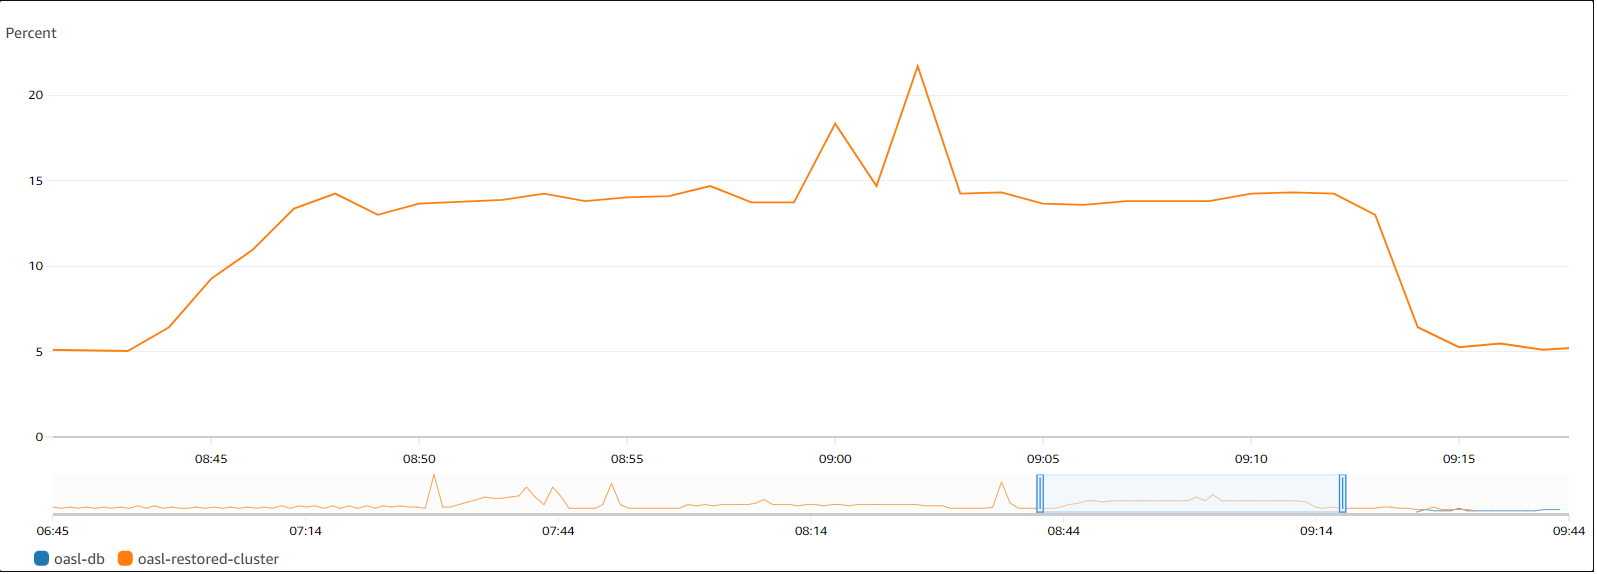
| RDS CPU utilization |
|
|
| Service CPU utilization |
|
|
| ACUs |
|
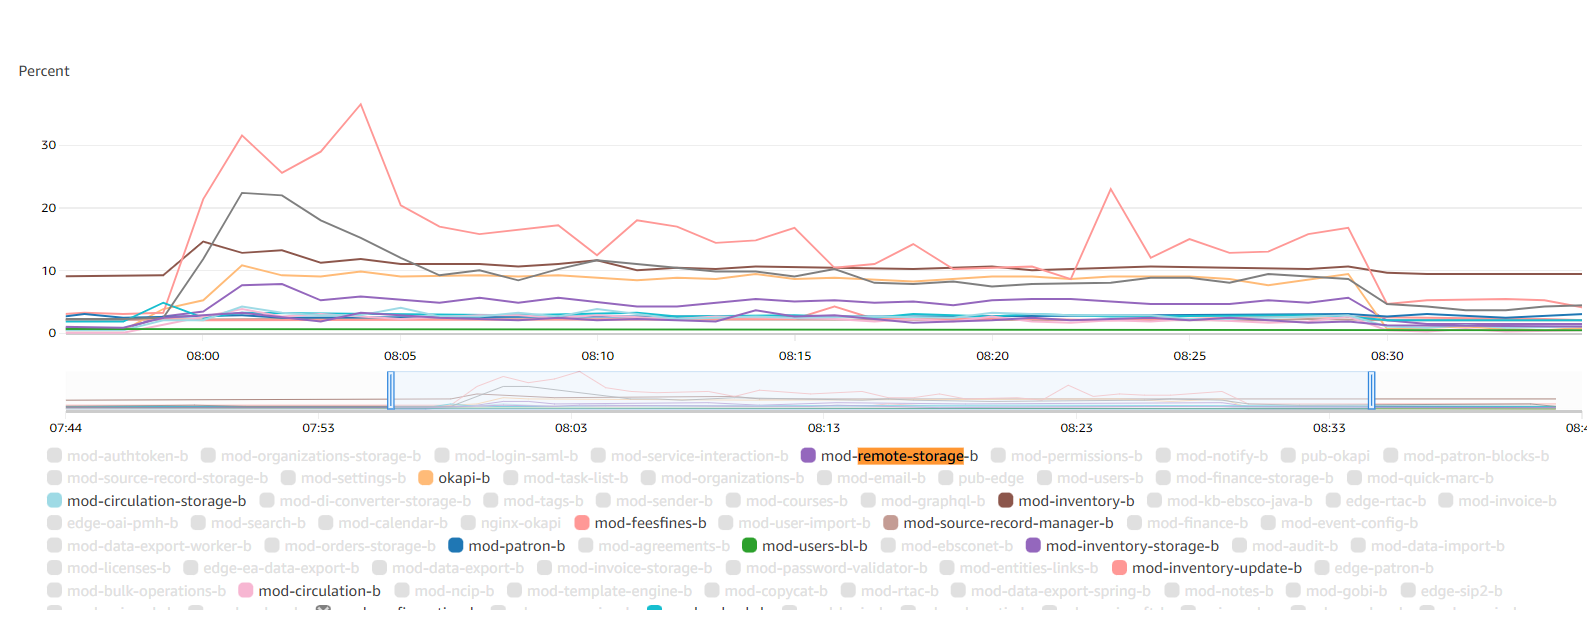
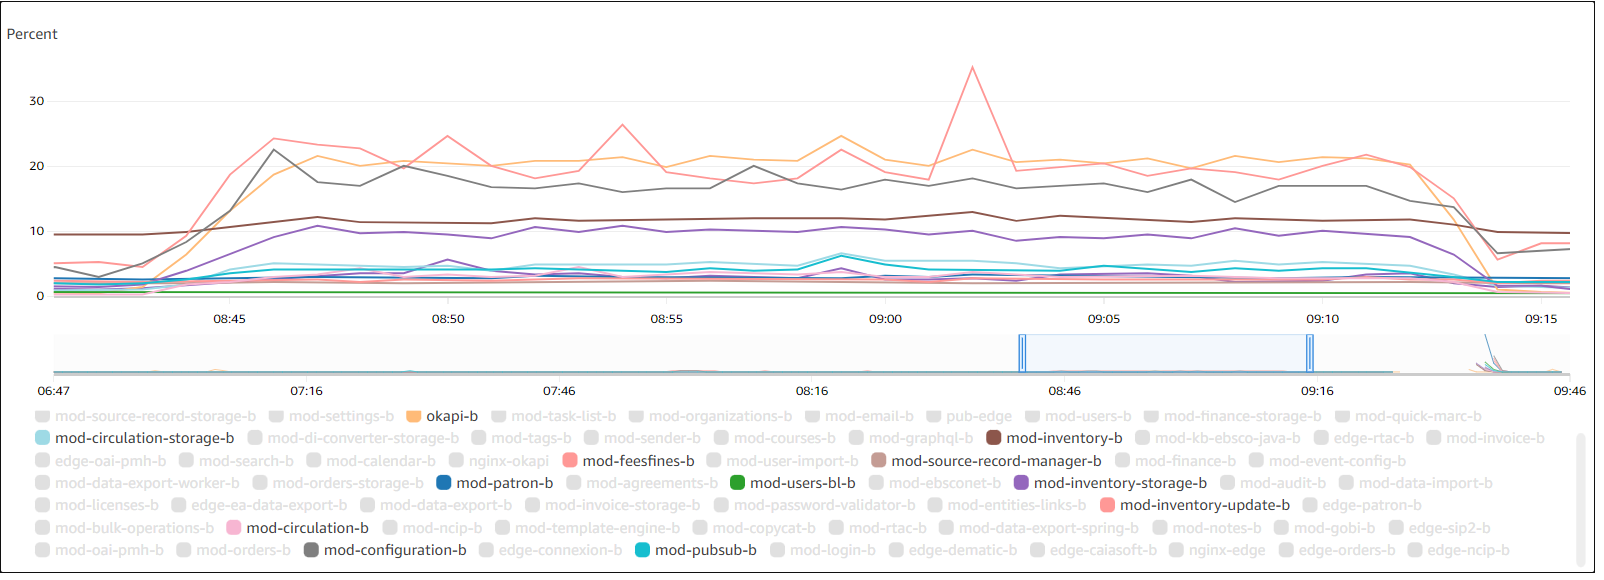
CICO response times
For Aurora serverless it was observed response time growth instantly after DI start with smooth decreasing while executing (PTF - Create 2 job profile).
For xlarge DB instance type CPU utilization during CICO stayed stable on level of 15% and after DI with 10k file rapidly go to 93% and stay on this level during all process of DI.
Serverless v2 (0.5 - 128 ACUs) | Before 10k | During 10k | During 25k | ||||||||||||
| Requests | 75th pct | 95th pct | Average | Latency_avg | 75th pct | 95th pct | Average | Latency_avg | 75th pct | 95th pct | Average | Latency_avg | |||
| Create | Check-In Controller | 2.928 | 3.171 | 2.855 | 1.851 | 3.391 | 3.999 | 3.248 | 2.242 | 3.156 | 3.427 | 3.06 | 2.07 | ||
| Check-Out Controller | 4.198 | 5.012 | 4.106 | 2.788 | 4.82 | 5.672 | 4.642 | 3.311 | 4.53 | 4.93 | 4.407 | 3.085 | |||
| Update | Check-In Controller | 2.93 | 3.09 | 2.807 | 1.823 | 2.966 | 3.152 | 2.882 | 1.883 | 3.048 | 3.256 | 2.951 | 1.948 | ||
| Check-Out Controller | 4.176 | 4.97 | 4.152 | 2.841 | 4.23 | 4.46 | 4.134 | 2.823 | 4.42 | 5.012 | 4.327 | 2.997 | |||
RDS (db.r6g.xlarge) | |||||||||||||||
| Create | Check-In Controller | 2.764 | 2.867 | 2.786 | 1.788 | 3.204 | 3.461 | 3.077 | 2.08 | 3.318 | 3.606 | 3.176 | 2.178 | ||
| Check-Out Controller | 4.02 | 4.155 | 4.045 | 2.74 | 4.628 | 4.976 | 4.466 | 3.148 | 4.861 | 5.181 | 4.672 | 3.341 | |||
| Update | Check-In Controller | 2.816 | 3.078 | 2.74 | 1.757 | 2.825 | 2.928 | 2.837 | 1.848 | 2.853 | 2.952 | 2.868 | 1.873 | ||
| Check-Out Controller | 4.06 | 4.252 | 3.943 | 2.632 | 4.077 | 4.202 | 4.097 | 2.78 | 4.126 | 4.243 | 4.154 | 2.839 | |||
Appendix
Folio release: Orchid
Resource usage: R/W split disabled for all modules
Links to Grafana
Test date: 2023-05-25 - 2023-05-31
Baseline xlarge
Baseline 8xlarge
Aurora Serverless
Test date: 2023-06-02 - 2023-06-06
db.r6g.xlarge
8 users:
20 users:
db.r6g.8xlarge
8 users:
20 users
Serverless v2 (0.5 - 128 ACUs)
8 users:
20 users:
Serverless v2 (32 - 128 ACUs)
8 users:
20 users:
Test date: 2023-06-13
Serverless v2 (0.5 - 128 ACUs) CICO DI Create + Update
db.r6g.xlarge
Configuration
DI
| Version of modules: |
|---|
| Source Record Manager Module (mod-source-record-manager-3.6.2) |
| Source Record Storage Module (mod-source-record-storage-5.6.5) |
| Inventory Module (mod-inventory-20.0.4) |
| Inventory Storage Module (mod-inventory-storage-26.0.0) |
| Inventory Update Module (mod-inventory-update-3.0.1) |
| Data Import Module (mod-data-import-2.7.1) |
| quickMARC (mod-quick-marc-3.0.0) |
CICO
| Version of modules: |
|---|
Okapi (okapi-5.0.1) |
users (mod-users-19.1.1) |
Remote storage API module (mod-remote-storage-2.0.2) |
Pubsub (mod-pubsub-2.9.1) |
Patron Blocks Module (mod-patron-blocks-1.8.0) |
Inventory Storage Module (mod-inventory-storage-26.0.0) |
Inventory Module (mod-inventory-20.0.4) |
feesfines (mod-feesfines-18.2.1) |
Configuration (mod-configuration-5.9.1) |
Circulation Storage Module (mod-circulation-storage-16.0.0) |
Circulation Module (mod-circulation-23.5.4) |
authtoken (mod-authtoken-2.13.0) |
Environment
- UI endpoint: https://aurora-serverless-test.int.aws.folio.org/
- Okapi endpoint: https://okapi-aurora-serverless-test.int.aws.folio.org/
- Environment is configured to use shared MSK and ES
Created in INT account us-west-2 region, cluster name
oasl, created with snapshot of Cornell Test environment.Modules versions:
Orchid-GA.3
Task count: HA – okapi x3, mod-data-import, mod-data-export, mod-quick-marc, mod-data-export-spring x1, all other modules x2
OpenSearch:fse- shared domain (6 r6g.large.search datanodes)
MSK: dedicated cluster - total 4 brokers (kafka.m5.large)
RDS Configuration 1:db.r6g.8xlargeinstance, Aurora PostgreSQL 13.9
RDS Configuration 2:db.r6g.xlargeinstance, Aurora PostgreSQL 13.9
RDS Configuration 3: Aurora Serverless, min ACU: 0.5, max ACU: 128
RDS Configuration 4: Aurora Serverless, min ACU: 32, max ACU: 128