Testing Mode Studio on MacBook Pro laptop (macOS High Sierra 10.13.6, 2.9 GHz Intel Core i5, 16GB 2133 MHz LPDDR3 memory)
Connecting to Data Warehouse
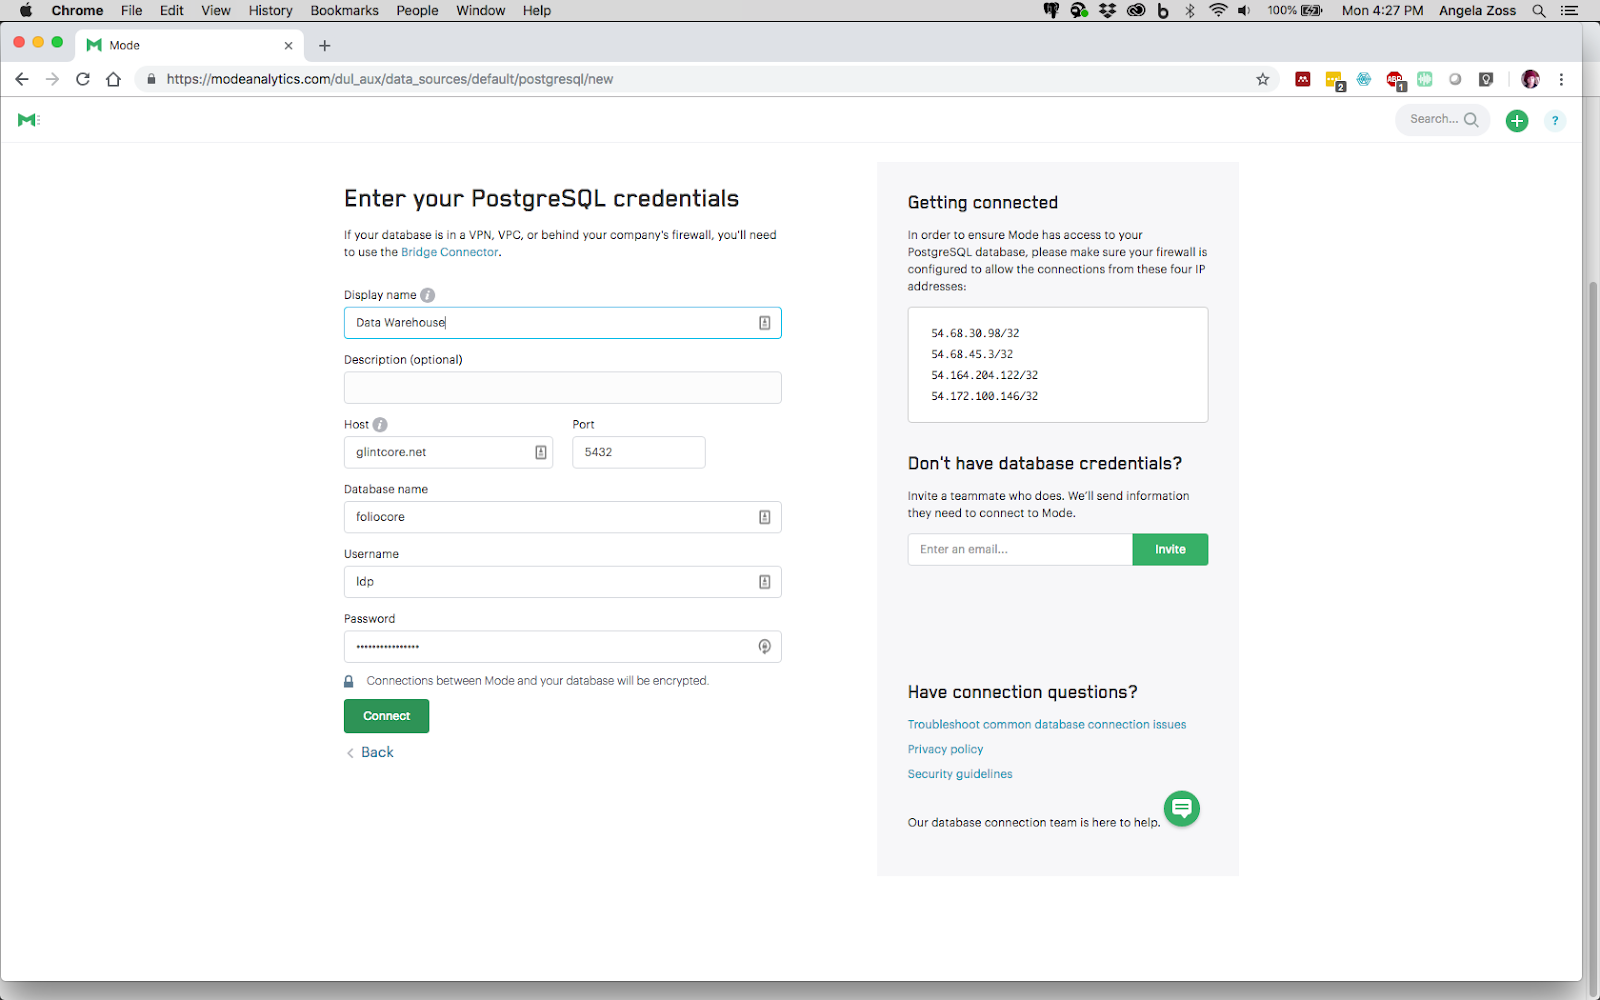
Log into Mode Click on the name of your organization and select “Connect a Database” from the menu Select PostgreSQL Enter the connection details Note: this is a cloud-based tool, so report requests will come from the IP addresses associated with the Mode servers. Mode servers will need permission to submit requests to the data warehouse.
| |
Executing Custom SQL
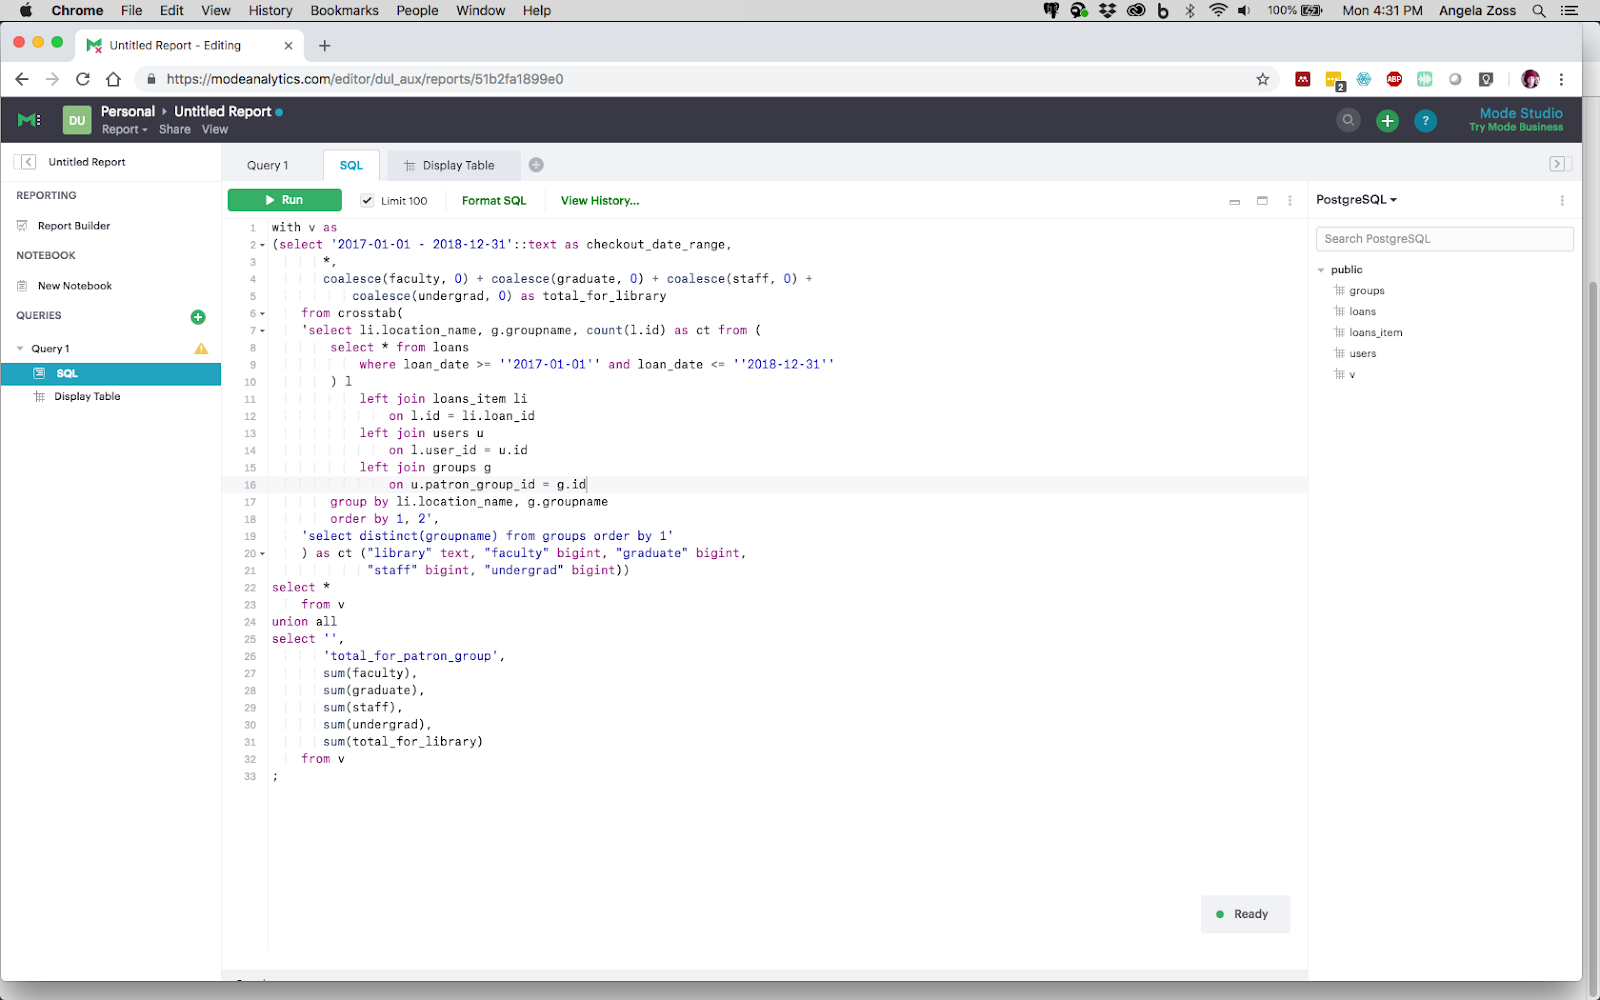
Create a new report Inside the report, use the “+” icon to add a new Query Paste in a SQL statement Click the Run button Results will appear below the query editor pane and also as a secondary “Display Table” tab, which will also appear in the left sidebar under the query
| 
|
Viewing and Saving Results
Basic Data Export to CSV
Immediately after executing the query, a user can Export the results using the link that appears under the SQL query pane. | 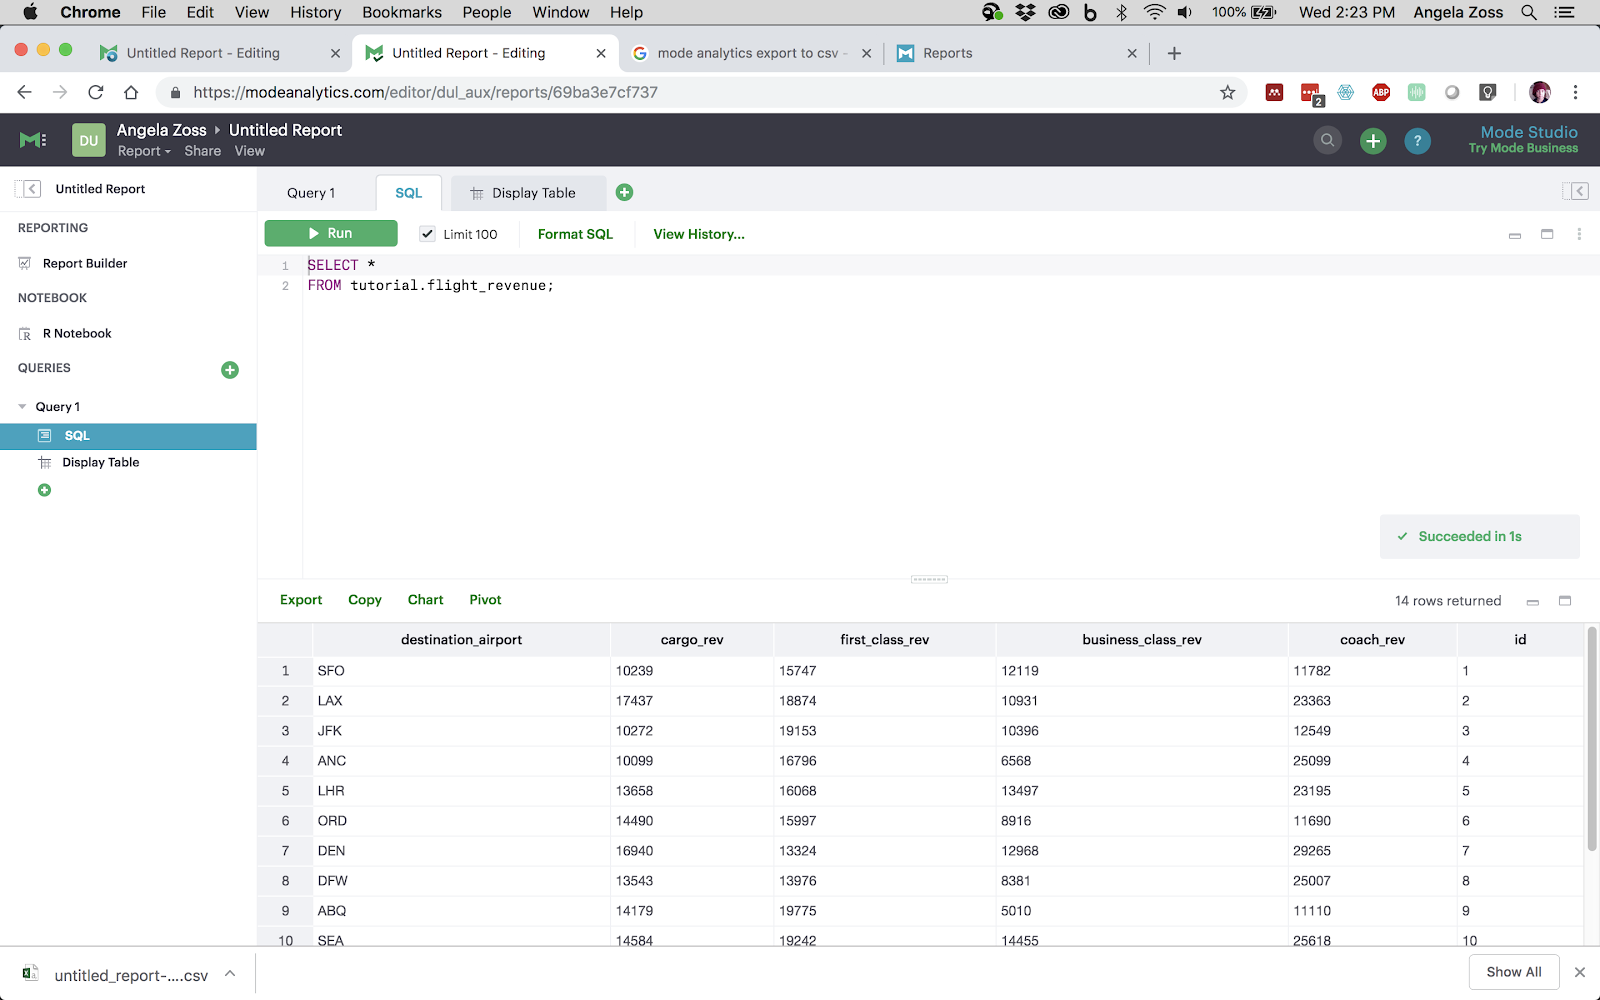
|
Custom Visualizations
and Reports from Results
After creating a SQL query, a user can use the “+” icon to add new representations based on the query. At the time of writing, Mode Studio offers the following representations:
Display Table Chart (Bar, Line, Bar + Line, Area, Scatter, Pie, Donut) Pivot Table Big Number
To combine different elements into a single report, click on “Report Builder” in the sidebar of the report editor. By default, all representations the user has created will appear in the report, but each can be resized, rearranged, or removed as needed. Reports can be shared via URL or exported to PDF. Each chart or table in the report is also accessible through its own direct URL, but there is no direct export of a chart to an image file or PDF. | |