Tableau
Please see the LDP wiki for the latest version of this page.
Testing Tableau Desktop v2018.3 on MacBook Pro laptop (macOS High Sierra 10.13.6, 2.9 GHz Intel Core i5, 16GB 2133 MHz LPDDR3 memory)
Connecting to Data Warehouse
|

Executing Custom SQL
Note: It is possible to join custom SQL to other existing tables in the database, which might be necessary if you can’t accomplish everything in a single SQL statement See also: Tableau documentation on custom SQL |


Building Queries In Tool
Tableau gives direct access to database tables, so tables can be joined ad hoc in the tool
|

Viewing and Saving Results
Basic Data Export to CSVImmediately after executing the query, a user can use the Data menu to export results to a .csv file, which could then be opened in Excel or another data analysis program. Formatting note: Tableau adds a “Number of Records” column automatically and may reorder other columns alphabetically, so the exported CSV may not match the Tableau table. | |
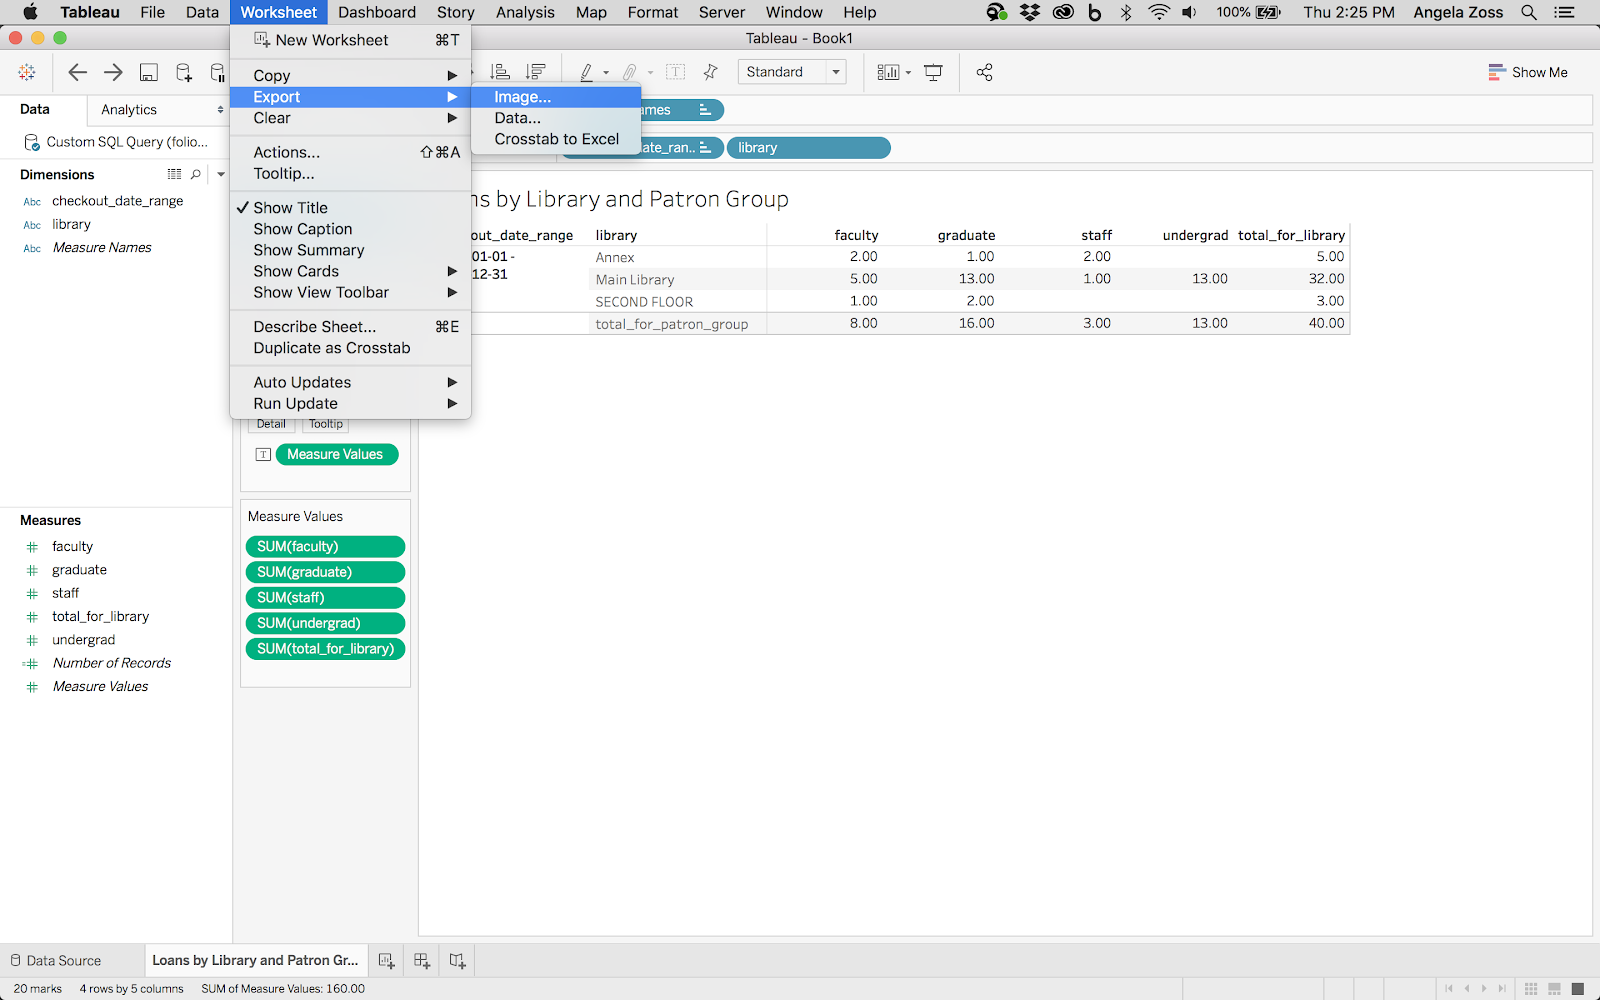
Export WorksheetIf you create a visualization based on the data from the query, Tableau Desktop will also allow you to export that visualization (either in a worksheet or in a dashboard) as an image (.png, .bmp, or .jpg format). You can also print worksheets and dashboards to PDF. You can also export just the data used in a particular worksheet from the Worksheet menu. | |
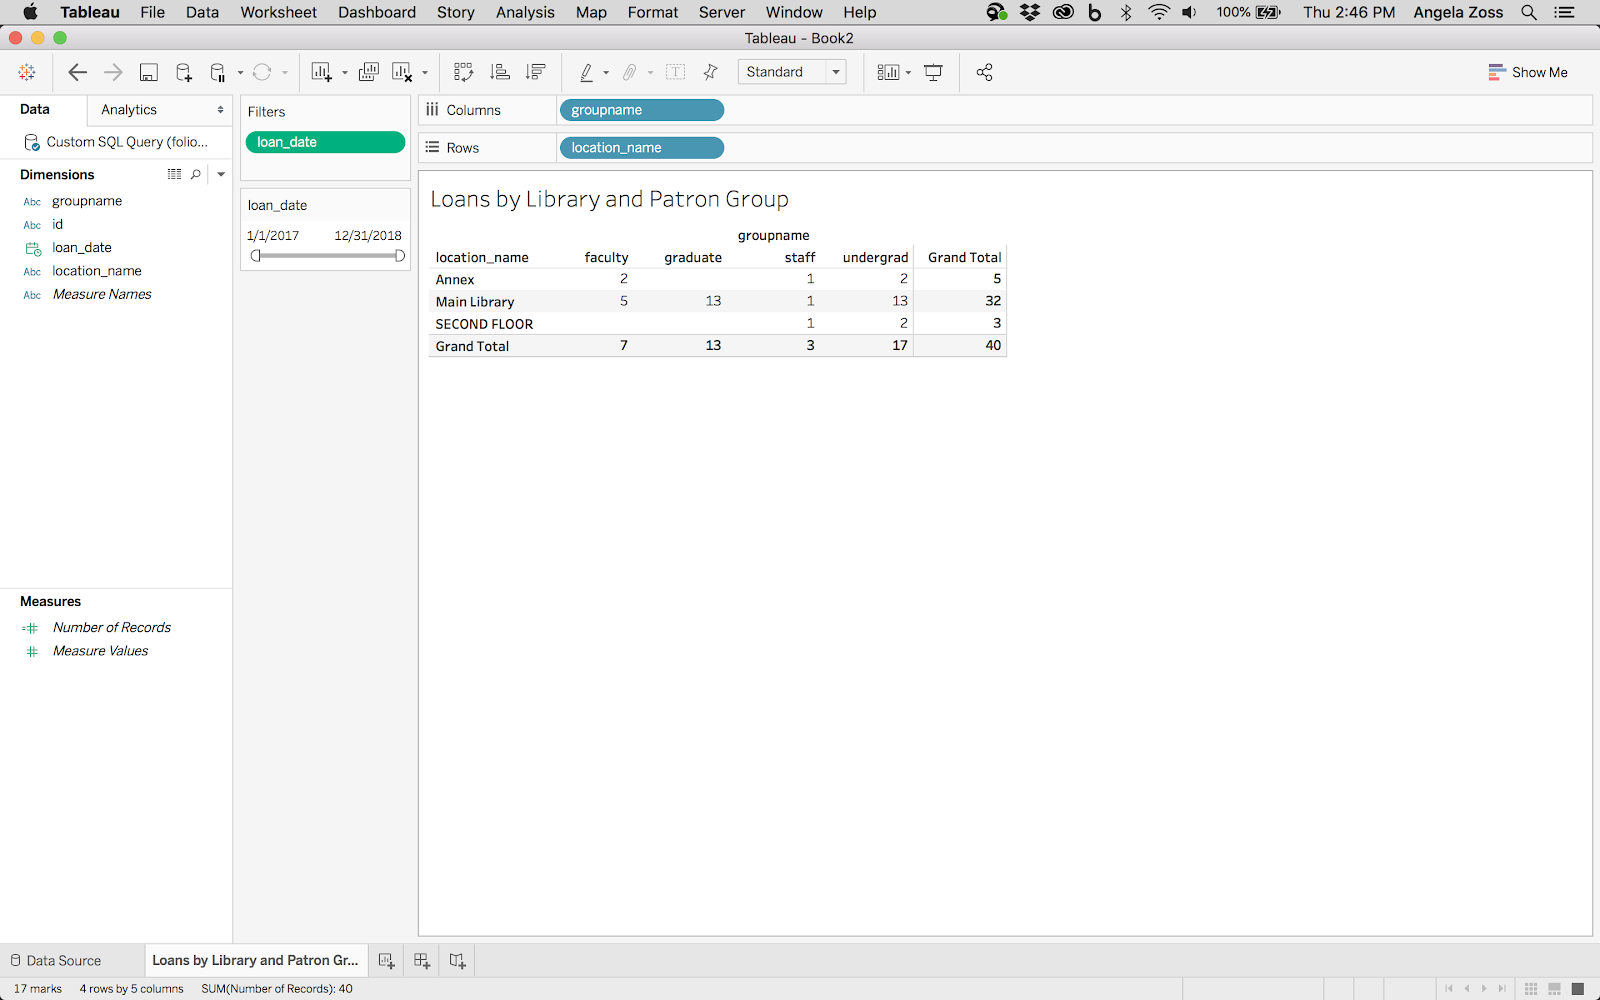
Custom Reports from ResultsTableau is designed to create visualizations, including both tables and charts/graphs. Tableau can easily add totals and subtotals, filter out certain groups or date ranges, create custom groups, change the names of variables and data points, etc. It may be possible or even advisable to generate custom visuals in Tableau rather than using a SQL query to perform aggregations and add formatting. You can either join the tables directly in Tableau or use custom SQL to join tables and select specific columns. |